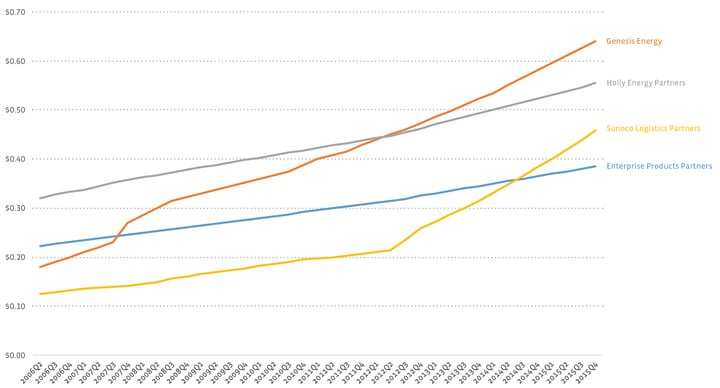
This is a small grouping, which indicates growth in every quarter is the road less traveled. Both Holly Energy Partners (HEP) and Enterprise Products Partners (EPD) have shown very steady increases over the time period, while Genesis Energy (GEL) and Sunoco Logistics Partners (SXL) have had a bit lumpier growth. It’s important to note that EPD has had a very high coverage ratio in comparison to its broader MLP peers, at times going as high as 1.6×. Over the past ten years, EPD investors have sometimes raised complaints, believing the company should be raising distributions faster and lumpier to give investors as much cash as possible. On the other hand, investors have also lauded the high coverage ratio during tougher times in the energy cycle.
MLPs that have primarily grown distributions for the last 10 years. These 10 companies have maintained or grown their distributions for each of the 39 quarters in the study, and have grown their distributions more times than they’ve maintained.
Occasional Distribution Maintenance Doesn’t Preclude Distribution Growth
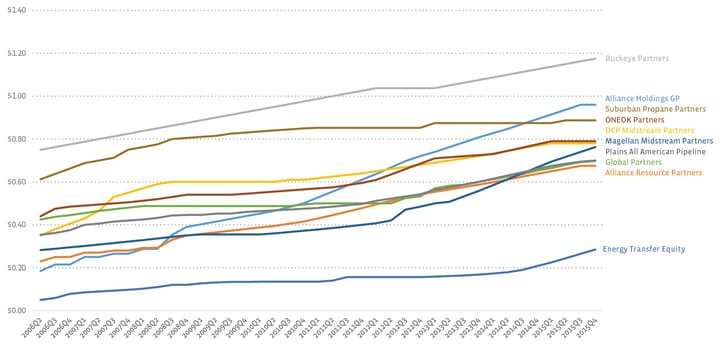
Plains All American (PAA) had the fewest quarters without growth (only two) which occurred in 2009. Looking back at an old press release, it appears that the decision to maintain was based on the “volatile global economic environment” at the time. Notably, because of the current difficult macro environment, PAA has also kept distributions flat so far in 2016.
Alliance Holdings GP (AHGP) made the largest jump over the study period, increasing distributions by $0.775 (418.9%). Check out how the line diverges upwards from Alliance Resource Partners (ARLP) and you can really see the benefit of incentive distribution rights (IDRs) in action! Conversely, in March 2009, Magellan Midstream Partners (MMP) bought its GP. After that time, their distribution growth began to accelerate and one possible reason for this is not having the GP/IDR drag.
MLPs that have primarily maintained distributions for the last 10 years. These 11 companies have also maintained or grown their distributions for each of the 39 quarters in the study, but have maintained more times than they’ve grown.
Primarily Maintaining Distributions Leads to Lumpier Growth
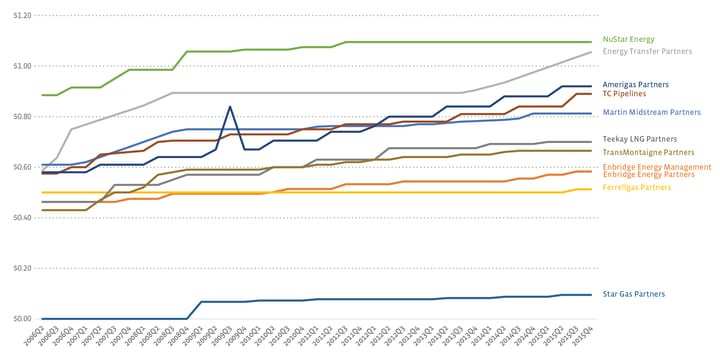
Many would agree that Ferrellgas Partners (FGP) was once the king of distribution maintenance. Starting in November of 1994, the company paid a predictable $0.50 distribution every quarter. Last year, FGP shocked investors (and our CEO) by raising its distribution 2.5% to $0.5125. Also noteworthy in this group is the “stair step” pattern followed by TC Pipelines (TCP). Beginning in 2009, the company has steadily raised its distribution one quarter a year, normally in Q3 except in 2010 when the increase occurred in Q4. I would call some of the names in this group the lumpiest. What I mean by this is that if an investor were to look at distribution growth for TCP between the first two quarters of 2015, they might surmise there is a problem because there was no distribution growth. However, between Q2 and Q3, there was a 5.95% increase. In order to compare TCP fairly to a company like EPD that raised its distribution a little less than 1.4% each quarter last year, investors must look at each company’s year over year growth. In this case, TCP’s annual growth was 4.8% and EPD’s was 5.6%.
Also, at first glance, it looks like Amerigas Partners (APU) should be placed in group four. Upon further inspection, however, I learned that a one-time payment of $0.17 was included in distributions paid to investors in Q3 2009 which represented a portion of the proceeds of a propane storage terminal sale in California. So, while distributions dipped back down in Q4 2009, the company didn’t technically “cut”. Similar to TCP, APU follows a noticeable “stair step” pattern, typically increasing distributions once a year in Q2.
MLPs that have cut distributions and continued operating. These are the five MLPs that are survivors (cue Destiny’s Child) despite significant distribution reductions.
CLMT and ENLK Grow Distributions After Cut
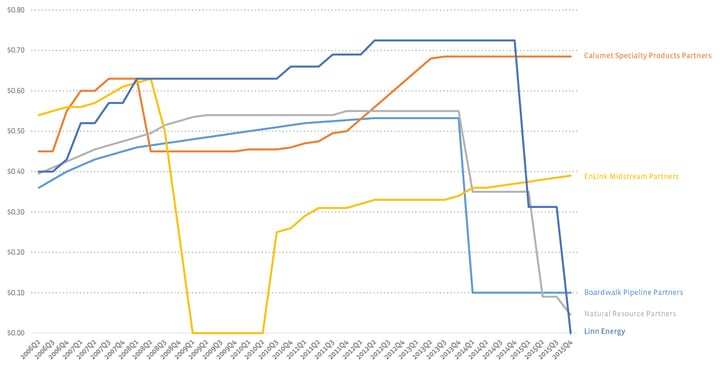
Some might say an MLP distribution cut signals the beginning of the end. This can be true, but not always. Take EnLink Midstream Partners (ENLK), for example. At the time of the cut, the company was called Crosstex Energy (XTEX). After surviving the great recession and merging their midstream assets with those owned by Devon Energy (DVN) to create ENLK, the business has seen a period of relatively steady distribution growth.
The others. As flashes of the Nicole Kidman horror film fill your mind, let me be clear that this bucket of 20 is not entirely filled with ghosts. It contains companies that are no longer in existence, one that is a variable MLP, and two that have a special circumstance. Here is the list:
No Longer in Existence
- Atlas Pipeline Partners (APL)
- Copano Energy (CPNO)
- Enterprise GP Holdings (EPE)
- Hiland Partners (HLND)
- Kinder Morgan Energy Partners (KMP)
- Kinder Morgan Management (KMR)
- K-Sea Transportation Partners (KSP)
- Magellan Midstream Holdings (MGG)
- MarkWest Energy Partners (MWE)
- Inergy Holdings (NRGP)
- Natural Resource Partners (NSP)
- Pacific Energy Partners (PPX)
- Penn Virginia Resource Partners (PVR)
- Regency Energy Partners (RGNC)
- Rio Vista Energy Partners (RVEP)
- TEPPCO Partners (TPP)
- US Shipping Partners (USS)
Variable
- Dorchester Minerals (DMLP)
Special Circumstance
-
Williams Partners (WPZ) – In late 2014, WPZ and Access Midstream Partners (ACMP) merged. It’s a little tricky because after the merger, ACMP changed its name to WPZ. Therefore, WPZ in its current form is not technically the same WPZ that was in the index in 2006. In Q1 2015, the distribution was “reset” from $0.9285 to $0.85 for the new entity.
- Inergy (NRGY) – Technically still around as Crestwood Equity Partners (CEQP). A similar name switcheroo occurred with NRGY/CEQP as we saw with ACMP and WPZ.
The MLPs in the “grown distributions for every quarter” bucket typically manage their distributions very carefully to ensure continuous growth. Whereas the “primarily grown” or “primarily maintained” buckets may reflect management teams paying out as much cash as possible as soon as it becomes available. And that reflects differing distribution management styles. One is not necessarily better than another, but may be a better fit for different investor groups and styles.
While it’s fair to say that the majority of MLPs have stable and growing distributions over an extended time period, it’s also easy to see that all MLPs don’t conform to a specific pattern. This is why the distribution growth of an MLP or an index is best viewed over an entire year, or even 10 years if you’ve followed the space as long as the AMZ has existed. Here’s to the first decade.

