ETFdb Logo
  • ETF Database
  • Content Hubs
    • Themes
      • Active ETF
      • Alternatives
      • Artificial Intelligence
      • China Insights
      • Core Strategies
      • Crypto
      • Disruptive Technology
      • Energy Infrastructure
      • ETF Building Blocks
      • ETF Investing
      • ETF Strategist
      • Financial Literacy
      • Fixed Income
      • Free Cash Flow
      • Future ETFs
      • Innovative ETFs
      • Institutional Income Strategies
      • Leveraged & Inverse
      • Market Insights
      • Market Outlooks
      • Modern Alpha
      • Nuclear Energy
      • Portfolio Strategies
      • Sector Investing
      • Tax Efficient Income
      • Thematic Investing
    • Asset Class
      • Equity
        • U.S. Equity
        • Int'l Developed
        • Emerging Market Equities
      • Alternatives
        • Gold/Silver/Critical Materials
        • Cryptocurrency
        • Currency
        • Volatility
      • Fixed Income
        • Investment Grade Corporates
        • US Treasuries & TIPS
        • High Yield Corporates
        • Int'l Fixed Income
    • ETF Ecosystem
    • ETFs in Canada
    • Market Outlook
    • Crypto ETF Hub
  • Tools
    • ETF Screener
    • ETF Country Exposure Tool
    • ETF Database Categories
    • Indexes
    • Scenario Analysis
    • Watchlists
    • Head-To-Head ETF Comparison Tool
    • Mutual Fund To ETF Converter
    • ETF Stock Exposure Tool
    • ETF Issuer Fund Flows
  • Research
    • ETF Education
    • Equity Investing
    • Dividend ETFs
    • Leveraged ETFs
    • Inverse ETFs
    • Index Education
    • Index Insights
    • Top ETF Sectors
    • Top ETF Issuers
    • Top ETF Industries
  • Webcasts
  • Sectors
    • Sector Investing Content Hub
    • XLK
    • XLI
    • XLU
    • XLY
    • XLP
    • XLRE
    • Sector Power Rankings
    • XLE
    • XLC
    • XLF
    • XLV
    • XLB
  • Multimedia
    • ETF 360 Video Series
    • ETF of the Week Podcast
    • Gaining Perspective Podcast
    • ETF Prime Podcast
    • Video
  • Company
    • About VettaFi
  • PRO
    • Pro Content
    • Pro Tools
    • Advanced
    • FAQ
    • Free sign up
    • Login
  1. Index Insights
  2. How Does Alerian Calculate Distribution Growth?
Index Insights
Share

How Does Alerian Calculate Distribution Growth?

Karyl PatredisFeb 28, 2016
2016-02-28

How do you calculate distribution growth?

If a slide could be awarded an Ammy for popularity, our distribution growth chart would capture the vote. Over the past year or so, I’ve gained many EFs. I’d say about 75% of my EFs have emailed me at least once asking when Alerian’s beloved distribution growth chart would be posted.

Curious why we didn’t have something out on January 1? We were waiting for all the MLPs in the AMZ to report the distributions related to the fourth quarter. (How else can you calculate y/y distribution growth if you don’t have a full year of distributions?) Well, the wait is over. Here is the distribution growth chart for the Alerian MLP Index (AMZ).

5.-distribution-growth

Many have also asked how we calculate distribution growth. Here’s the scoop:

First, we examine the individual distribution growth rates for each index constituent on a quarterly basis. Those constituent-level growth rates are then multiplied by each constituent’s weight in the index. Those weighted values are then combined to give the overall weighted quarterly distribution growth for the index. That growth rate is then set to its own index. We then calculate the annual distribution growth by comparing the sum of the index values from the four quarters in each year vs the sum of the index values from the four quarters of the previous year.

The process is a little bit confusing, or at least, it was a little confusing to me before our data team explained it to me in terms my 7-year-old goddaughter could understand. A common misconception is that we simply take the weighted distribution growth of each quarter and sum the four quarterly growth numbers to arrive at the annual number. Don’t let yourself be tripped up by this. In 2015, the distribution growth numbers by quarter for the AMZ were 1.1% (Q1), 0.9% (Q2), 1.6% (Q3), and 1.0% (Q4). These figures sum to 4.6% not 5.1%. The reason for the discrepancy is that, as I touched on above, the annual distribution growth in a given year is based on a comparison to the previous year.

Think of it like this:

You’re a no-nonsense parent that decides to give your child raises on his allowance each quarter based on merit.

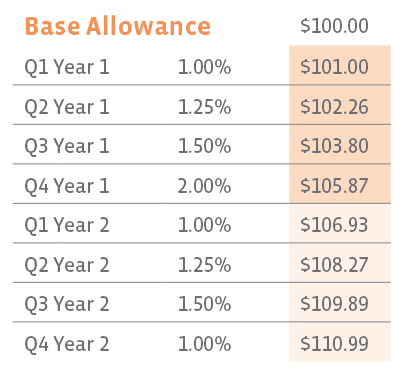
The first payment is a freebie which you give to your child for Christmas. It’s $100 big ones. All raises will be based off this $100 base value. In Q1 of the first year, you give your child a 1% raise. Q2 a 1.25% raise and so on as shown in the chart below:


Content continues below advertisement

This is the image alt text

To calculate the percentage of your child’s allowance growth, you’d add up the total amount he received in year 1, $412.93, and the total amount he received in year 2, $436.08. You’d then divide the total from year 2 by the total from year 1 and subtract 1. ($436.08/$412.93) – 1 = 5.6%. This would give you the annual allowance growth.

This is almost exactly how it works with the distribution growth calculation, with the key difference being that the figures in our equation are not dollars, but indexed growth numbers.

One other frequently confused item is which data we’re applying to each quarter. When Alerian calculates the distribution growth rate for 4Q15, we use the distributions announced and paid in 1Q16. We do it this way because it best reflects the performance of the MLP/business/assets during the period we reference. The distributions paid in 1Q16 are a result of the company’s performance during 4Q15. Some investors get mixed up because they use the period in which the distribution was paid. Please don’t let this be a stumbling block for you when you’re trying to double check our numbers.

As always, if you have further questions, email me at [email protected]. I’m always looking for new EFs.


» Popular Pages

  • Tickers
  • Articles

Jun 17

How Electricity Trends Could Favor Uranium Miners

Jun 17

Unlocking Active Alpha in Fixed Income with Fidelity

Jun 17

Retail Sales: Consumer Spending Up for Fourth Straight Month

Jun 17

2026 ETF Flows Cross $1 Trillion Milestone Before Summer

Jun 17

Despite Uncertainties the U.S. Economy Powers On

Jun 17

Income-Based ETFs Standing Tall Amid Crypto Struggles

Jun 17

Warsh’s Uphill Battle

Jun 17

Procure Space ETF (UFO) Adds SpaceX Following Historic Debut

Jun 17

Why First-Mover Advantage Matters for the Best Active ETFs

Jun 17

Expanding the Suite: Harbor Launches Active Commodity ETF

QQQ

Invesco QQQ Trust Series I

VOO

Vanguard S&P 500 ETF

SMH

VanEck Semiconductor ETF

GLD

SPDR Gold Shares

SOXX

iShares Semiconductor ETF

SCHD

Schwab US Dividend Equity ETF...

DRAM

Roundhill Memory ETF

PPLT

abrdn Physical Platinum...

SPY

State Street SPDR S&P 500 ETF...

SIVR

abrdn Physical Silver Shares...

Loading Articles...

Advertisement

Is Your Portfolio Positioned With Enough Global Exposure?

ETF Education Channel

How to Allocate Commodities in Portfolios

Tom LydonApr 26, 2022
2022-04-26

A long-running debate in asset allocation circles is how much of a portfolio an investor should...

Core Strategies Channel

Why ETFs Experience Limit Up/Down Protections

Karrie GordonMay 13, 2022
2022-05-13

In a digital age where information moves in milliseconds and millions of participants can transact...

}
X