
Summary
- Generally, energy infrastructure corporations tend to be larger and have a higher credit quality than MLPs, while MLPs offer higher, tax-advantaged yield.
- The Alerian MLP Index (AMZ) has greater exposure to companies focused on petroleum pipelines, while the Alerian Midstream Energy Corporation Index (AMCC) is biased towards natural gas pipelines.
- Performance comparisons between AMZ and AMCC will vary based on how different macro drivers impact constituents, but structure alone is not typically a primary determinant of performance.
The North American energy infrastructure universe consists of Master Limited Partnerships (MLPs) and US and Canadian corporations, which transport, store, and process hydrocarbons. Business activities are similar, but tax treatment differs, with MLPs receiving special advantages as pass-through entities in the US. Beyond the obvious tax differences, how do midstream MLPs and C-Corps compare when it comes to performance, yields, credit quality, and other metrics? Today’s note compares energy infrastructure MLPs and corporations using the Alerian MLP Index (AMZ) and the Alerian Midstream Energy Corporation Index (AMCC).
Introducing AMCC – the midstream C-Corp benchmark.
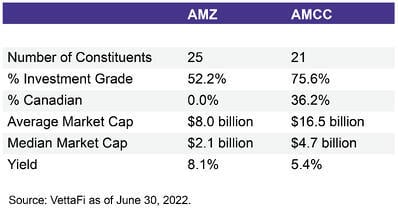
As the number of midstream corporations increased and their share of the universe market capitalization grew over time, it was clear that an energy infrastructure C-Corp benchmark was needed. AMCC includes midstream companies based in the US and Canada that are taxed as corporations. At the end of June, AMCC was 36.2% Canadian corporations. AMCC’s methodology is similar to the AMZ in that constituents are weighted based on float-adjusted market capitalization and the largest constituents are capped at 10%. These similarities help facilitate comparisons between these two indexes as proxies for MLPs and corporations in aggregate. The AMCC Index began live calculation in December 2019.
AMZ vs. AMCC: Comparing MLPs and corporations with index data.
AMZ and AMCC index-level data is useful for making generalizations about MLPs and corporations as a group. (Investors weighing an investment in an individual MLP against an individual corporation should clearly perform a more focused comparison.) As shown in the table below, corporations are larger by market capitalization and have better credit profiles as evidenced by a higher investment-grade weighting for AMCC. MLPs tend to offer more generous income, with the yield on AMZ sitting 270 basis points above that of AMCC at the end of June. MLP income is not only higher but tends to be largely tax-deferred, which is a key benefit of the MLP structure (read more).
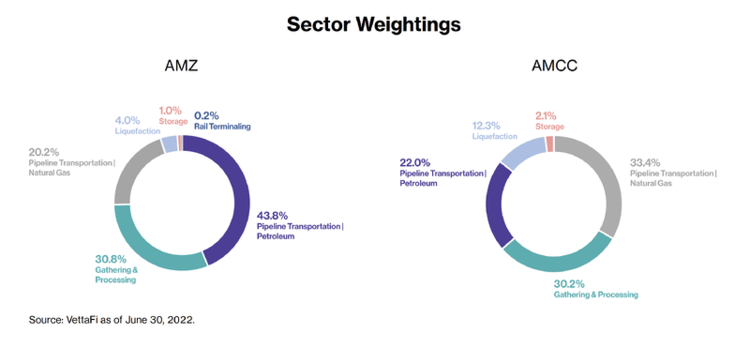
AMZ and AMCC also differ in their subsector exposure, with the MLP index providing greater exposure to companies focused on petroleum pipelines (43.8% of AMZ) and the C-Corp index biased towards natural gas pipelines (33.4% of AMCC). Both offer similar exposure to gathering & processing (G&P) companies at ~30% of the index by weighting. However, the G&P names in AMZ are smaller (i.e. market cap below $10 billion) and higher beta compared to some of the G&P corporations in AMCC, such as Williams (WMB), which had a market cap near $40 billion at the end of June and is a component of the S&P 500. Liquefaction accounts for 12.3% of AMCC, which is three times the weighting of liquefaction in AMZ. Cheniere Energy Partners (CQP) is the lone liquefaction name in AMZ.
Performance differences are more about constituents and less about structure.
Over the years, there has been some debate around performance differences between MLPs and corporations. There was a view that corporations should outperform MLPs because of their simpler tax reporting (1099 instead of Schedule K-1) and their eligibility for broad market indexes, which benefit from flows into passive products (assuming inflows and not outflows). On the other hand, one could argue that MLPs should outperform because of their higher yield and tax advantages. In VettaFi’s view, performance differences between MLPs and corporations have more to do with the characteristics of the companies (business activity, asset geography, size, etc.) than corporate structure. An exception to this would be regulatory issues or tax changes specific to MLPs or corporations.
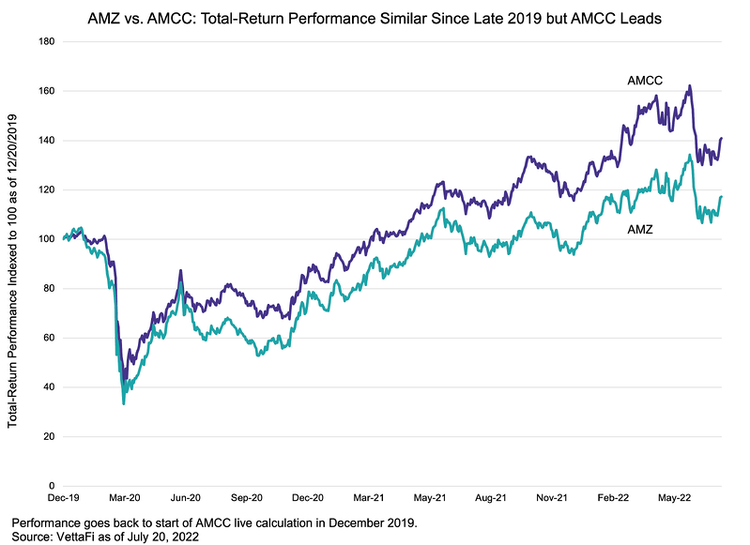
Since its launch in late December 2019, the AMCC Index has outperformed the AMZ Index on a total-return basis despite its lower yield as shown in the chart below. However, since both indexes hit relative highs on June 7, AMZ has outperformed AMCC by 90 basis points through July 20. Performance comparisons between AMZ and AMCC will vary based on how different macro drivers impact constituents. For example, at the end of June, Cheniere Energy (LNG) was the largest component of AMCC and up over 30% for 1H22 after gaining almost 70% in 2021, significantly outpacing gains for AMZ and AMCC in both periods. A portion of AMCC’s outperformance relative to AMZ could be ascribed to its greater exposure to strengthening global LNG markets through Cheniere. All this to say, a number of factors will explain the relative performance of AMZ and AMCC, but typically constituent structure is not a primary determinant.
Bottom Line:
AMZ and AMCC allow for broad comparison of midstream MLPs and corporations beyond their different tax treatment.
AMZ is the underlying index for the JP Morgan Alerian MLP Index ETN (AMJ), the ETRACS Alerian MLP Index ETN Series B, and ETRACS Quarterly Pay 1.5x Leveraged Alerian MLP Index ETN.
Related Materials:
MLP Taxation: The Benefits and What You Need to Know