ETFdb Logo
  • ETF Database
  • Content Hubs
    • Themes
      • Active ETF
      • Alternatives
      • Artificial Intelligence
      • China Insights
      • Core Strategies
      • Crypto
      • Disruptive Technology
      • Energy Infrastructure
      • ETF Building Blocks
      • ETF Investing
      • ETF Strategist
      • Financial Literacy
      • Fixed Income
      • Free Cash Flow
      • Future ETFs
      • Innovative ETFs
      • Institutional Income Strategies
      • Leveraged & Inverse
      • Market Insights
      • Market Outlooks
      • Modern Alpha
      • Nuclear Energy
      • Portfolio Strategies
      • Sector Investing
      • Tax Efficient Income
      • Thematic Investing
    • Asset Class
      • Equity
        • U.S. Equity
        • Int'l Developed
        • Emerging Market Equities
      • Alternatives
        • Gold/Silver/Critical Materials
        • Cryptocurrency
        • Currency
        • Volatility
      • Fixed Income
        • Investment Grade Corporates
        • US Treasuries & TIPS
        • High Yield Corporates
        • Int'l Fixed Income
    • ETF Ecosystem
    • ETFs in Canada
    • Market Outlook
    • Crypto ETF Hub
  • Tools
    • ETF Screener
    • ETF Country Exposure Tool
    • ETF Database Categories
    • Indexes
    • Scenario Analysis
    • Watchlists
    • Head-To-Head ETF Comparison Tool
    • Mutual Fund To ETF Converter
    • ETF Stock Exposure Tool
    • ETF Issuer Fund Flows
  • Research
    • ETF Education
    • Equity Investing
    • Dividend ETFs
    • Leveraged ETFs
    • Inverse ETFs
    • Index Education
    • Index Insights
    • Top ETF Sectors
    • Top ETF Issuers
    • Top ETF Industries
  • Webcasts
  • Sectors
    • Sector Investing Content Hub
    • XLK
    • XLI
    • XLU
    • XLY
    • XLP
    • XLRE
    • Sector Power Rankings
    • XLE
    • XLC
    • XLF
    • XLV
    • XLB
  • Multimedia
    • ETF 360 Video Series
    • ETF of the Week Podcast
    • Gaining Perspective Podcast
    • ETF Prime Podcast
    • Video
  • Company
    • About VettaFi
  • PRO
    • Pro Content
    • Pro Tools
    • Advanced
    • FAQ
    • Free sign up
    • Login
  1. Index Insights
  2. Monday Mailbag: How Do Incentive Distribution Rights Work?
Index Insights
Share

Monday Mailbag: How Do Incentive Distribution Rights Work?

Karyl PatredisOct 19, 2015
2015-10-19

I’ve heard people say a certain MLP is in the “high splits” or “50/50 splits” with its GP. If a company announces a $1.00/unit distribution, does that mean the common unitholder will only receive $0.50/unit?

Ninth grade geometry was like a nightmare for me, and continues to haunt me to this day. I vividly remember sitting in Mrs. Schmidt’s class with a test full of empty blanks and triangles on it. I’d write, “1. Given” and then panic silently because I had no idea what the next step in writing a proof was. For whatever reason, geometry did not naturally click in my brain. Incentive Distribution Rights (IDRs) didn’t either. Fortunately for me, unlike in ninth grade geometry, I had a very patient Alerian Director take the time to pick the puzzle apart for me and explain IDRs in terms simple enough for a baby to understand. My goal is to pay that favor forward so that you won’t be panicking silently next time you’re asked how IDRs work.

The first thing you must understand is that MLP units are not owned exclusively by third party LP unitholders. The MLP’s GP also owns a small portion of the outstanding units; this is known as ownership interest. For example, in Enbridge Energy Partners’ (EEP) 2014 10-K, the company notes, “Distributions of our available cash are generally made 98% to holders of our limited partner units and 2% to our General Partner.” This confused me. It sounded to me like the GP was siphoning off $0.02 from each dollar that really should have gone to the LP unitholders. This is not correct! What this means is that if EEP had 100 total units, 98 are owned by LP unitholders and 2 are owned by the GP. LP unitholders still get their full dollar. In fact, LP unitholders will always get the full amount declared even when IDRs start kicking in.

So, here is the deal with IDRs. They are put in place to incentivize the GP to grow LP distributions by entitling GPs to receive a higher percentage (generally up to 50%) of incremental cash distributions when the distribution to LP unitholders reaches certain thresholds. This means that the GP doesn’t receive IDRs from the get-go. The MLP doesn’t start paying the GP until its declared distribution reaches a certain amount, and even then, the math to figure out what the GP actually receives is painfully confusing. At least, it was painfully confusing to me. Let me unpack it for you with an example.

Preston Jay Partners, LP (PresJP) has 100 total outstanding units. Of these, 98 are owned by the LP common unitholders, and 2 are owned by PresJP’s GP, Preston Jay Holdings (PresJH).

Here is PresJP’s IDR schedule:

This is the image alt text


Let’s pretend that PresJP announced a $0.55/unit distribution for Q3 2015. Before gaining a real understanding of this, I thought you took $0.55, divided it by two, and called it a day. 50/50 split, right? Seemed a little unfair that the LP unitholders had to give up half their distributions, but, agreements are agreements. This is not correct! Remember, the LP unitholders will always get the full amount of the distribution declared.


Content continues below advertisement

This is the image alt text

EXCEL IDR TEMPLATE Button

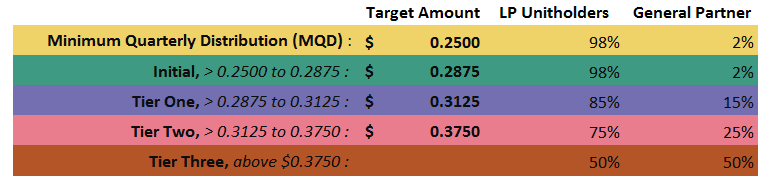
Grab my hand and I’ll walk you through this line by line to help you understand what will be owed to the GP. As we get started, compare these tiers to the progressive tax system (explained in more detail here). Each “section” will be treated differently.

Yellow Section
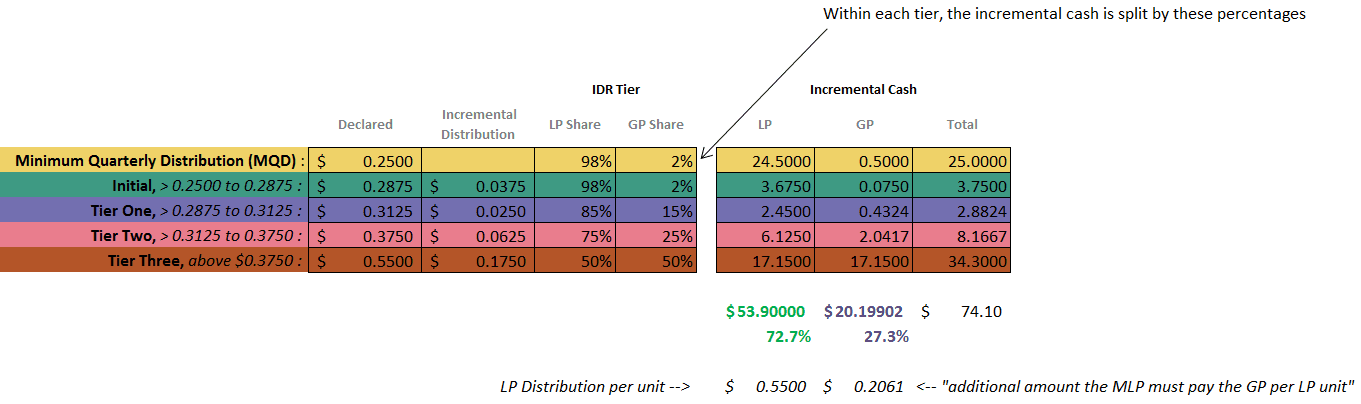
This section is pretty straightforward. There’s no fancy business occurring here. The first $0.25 is simply multiplied by the 100 units outstanding to get $25 in total distributions. 98% of the $25, $24.50, goes to the LP unitholders, and the other 2%, $0.50, goes to the GP. IDRs haven’t kicked in yet.

Green Section
This section also works out as you might expect because IDRs still haven’t started yet. You take the 2nd sliver of distribution, $0.0375, found by subtracting the yellow target amount from the green target amount, and multiplying it by 100 to get $3.750. $3.675 goes to LP unitholders and $0.075 goes to the GP.

Purple Section
This is where things get real. IDRs are now in play. To determine what portion of the distribution paid will be subject to IDRs, start by subtracting the green section target amount from the purple section target amount.

$0.3125 – $0.2875 = $0.0250

Multiply this by 100 for the total amount paid at this level ($2.50), then multiply $2.50 by 98% to figure out the cash owed to the LP unitholders. The answer is $2.45. (The remaining $0.05 goes to the GP because of their 2% ownership interest.)

At this level, only 85% of this tier’s cash should go to the LP, so the MLP has to pay additional cash to the GP (this is the IDR payment). To determine how much more, we have to figure out how much should be paid.

Backing into the math, divide $2.45 by 85% to get $2.8824. Since we already know what the LP unitholders get, subtract that amount ($2.45) from the total ($2.8824) and you’ll get $0.4324. This $0.4324 (or 15% of the total incremental distributions paid) is what goes to the GP. Note: This $0.4324 includes the $0.05 from the 2% GP interest, so the “IDR portion” is $0.4324-$0.05 = $0.3824.

Pink Section
Same ideas as described in the purple section, except the GP take at this level is 25%, so I’ll cut to the chase with the math only:


  1. Subtract the purple section target amount from the pink section target amount, $0.3750-$0.3125 = $0.0625

  2. $0.0625 × 100 = $6.25

  3. $6.25 × 98% = $6.125 owed to LP unitholders

  4. $6.125 ÷ 75% = $8.1667
  5. $8.1667 – $6.125 = $2.0417 owed to GP

Brown Section
Same business as the purple and pink sections, except the GP take at this level is 50%. Here is the math:

  1. Subtract the pink section target amount from the declared distribution, $0.55-$0.3750 = $0.1750
  2. $0.1750 × 100 = $17.50
  3. $17.50 × 98% = $17.15 owed to LP unitholders
  4. $17.15 ÷ 50% = $34.30
  5. $34.30 – $17.15 = $17.15 owed to GP

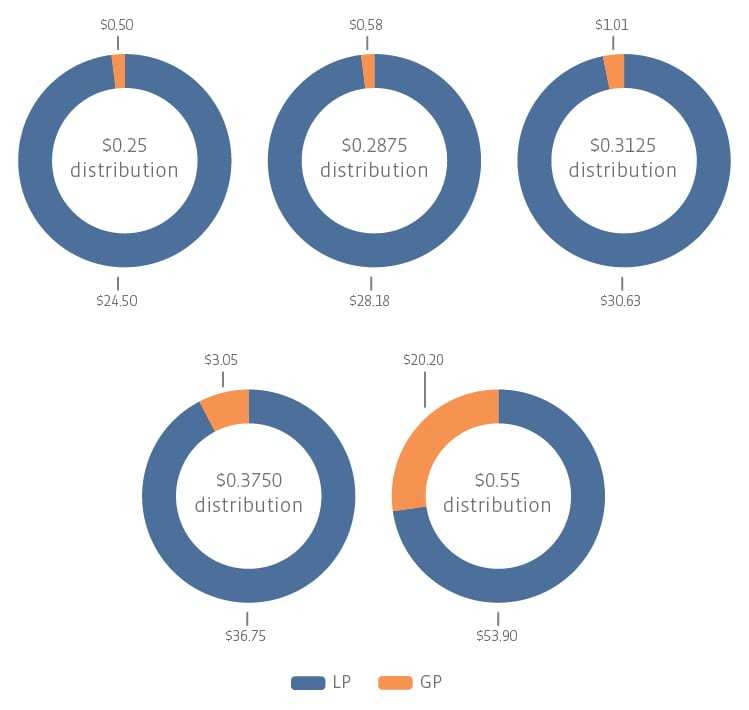
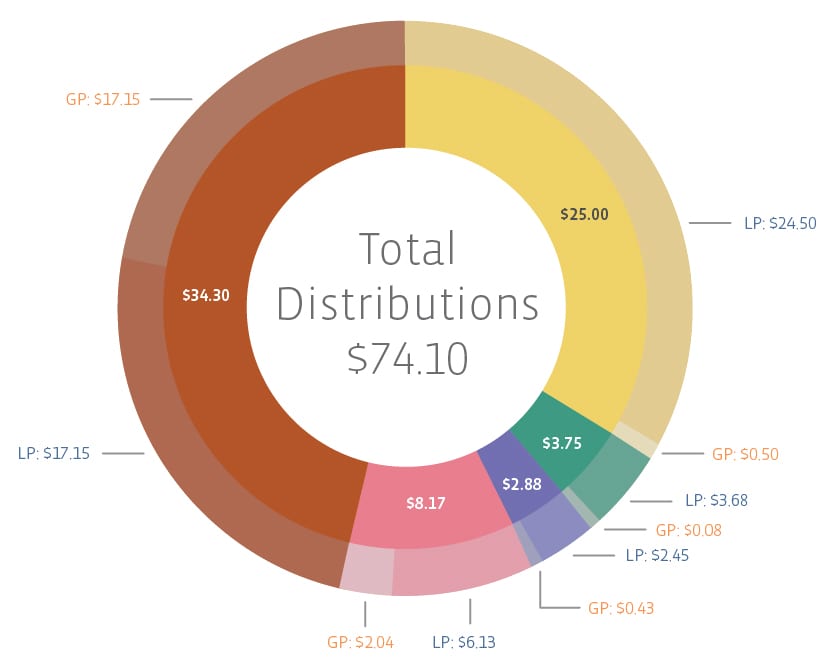
So what amount goes to the LP unitholders and what amount goes to the GP? Add everything up. In total, LP unitholders would receive $53.90 and the GP would receive $20.20 in this example. The total cash paid out would be $74.10 and the GP would end up receiving 27.3% of the pie – not 50%. I know. I was shocked too.

In case you still aren’t convinced that LP unitholders always get the full amount declared, if you take the $53.90 and divide it by 98 units, you get $0.55/unit, which is the declared distribution. Effectively, this also means the GP receives $0.2061 per LP unit ($20.20 divided by 98 units); this is not a real term, but may help you conceptualize that when $0.55/unit is paid to LP unitholders, an additional $0.2061 per LP unit must be paid to the GP. In a case where an MLP did not have a GP, this $0.2061 is extra cash flow that could have been paid to LPs.

This is the image alt text

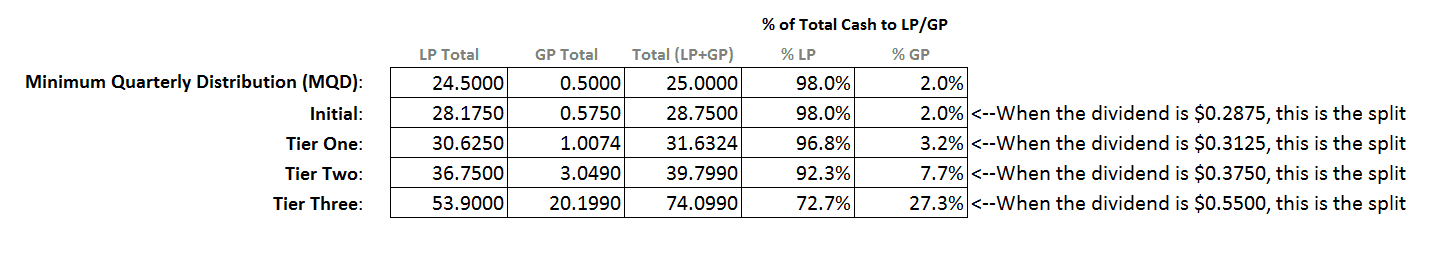
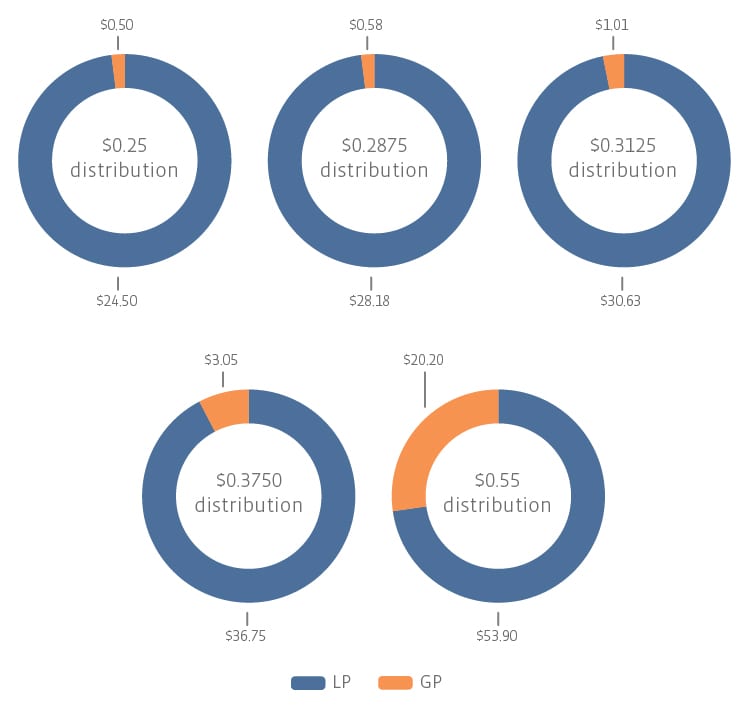
Additionally, here is a peek at how the splits look at each tier. For example, if PresJP hadn’t yet reached Tier Three, you can cover up the bottom tier to see that at Tier Two, if the dividend were $0.3750/unit, the LP would receive 92.3% of the pie, a significantly larger piece than in Tier Three. Speaking of pies, here are a few that show the splits at each level of distribution listed in the chart above and discussed in our example.

Distributions Pie Charts-01

Finally, here is a chart that highlights how cash is allotted at each tier level of our example.

Distributions Pie Charts-02

Hopefully, this illustration cleared up any confusion you’ve had over IDRs. If you have any additional questions or are an expert in geometry and would like to help me clear up my sketchy past with proofs, please email me at [email protected].

» Popular Pages

  • Tickers
  • Articles

Jun 18

S&P 500 Snapshot: Peace Deal Overcomes Fed Jitters

Jun 18

Treasury Yields Snapshot: June 18, 2026

Jun 18

Volatility Protection & Income in a Dynamic Buffered ETF

Jun 18

Covered Call ETFs Have Boomed – But Can They Be More?

Jun 18

Dimensional Consolidates $250B Lineup Into ETF Share Classes

Jun 18

NUKZ Holding Constellation Injects Millions Into Local Economies

Jun 18

What Drives Active ETF Growth? NEOS and Thornburg Weigh In

Jun 18

Capital Rotation: A Breakdown of This Week's Top ETF Flows

Jun 18

iShares Launches New Bitcoin Income ETF 

Jun 18

Kurv Launches SpaceX Enhanced Income ETF

VOO

Vanguard S&P 500 ETF

QQQ

Invesco QQQ Trust Series I

GLD

SPDR Gold Shares

PPLT

abrdn Physical Platinum...

SIVR

abrdn Physical Silver Shares...

SMH

VanEck Semiconductor ETF

SOXX

iShares Semiconductor ETF

SCHD

Schwab US Dividend Equity ETF...

QQQM

Invesco NASDAQ 100 ETF

XLK

State Street Technology...

Loading Articles...

Advertisement

Is Your Portfolio Positioned With Enough Global Exposure?

ETF Education Channel

How to Allocate Commodities in Portfolios

Tom LydonApr 26, 2022
2022-04-26

A long-running debate in asset allocation circles is how much of a portfolio an investor should...

Core Strategies Channel

Why ETFs Experience Limit Up/Down Protections

Karrie GordonMay 13, 2022
2022-05-13

In a digital age where information moves in milliseconds and millions of participants can transact...

}
X