ETFdb Logo
ETFdb Logo
  • ETF Database
  • Channels
    • Active ETF
    • Beyond Basic Beta
    • China Insights
    • Climate Insights
    • Commodities
    • Core Strategies
    • Crypto
    • Direct Indexing
    • Disruptive Technology
    • Energy Infrastructure
    • ETF Building Blocks
    • ETF Education
    • ETF Strategist
    • Financial Literacy
    • Fixed Income
    • Gold/Silver/Critical Minerals
    • Innovative ETFs
    • Institutional Income Strategies
    • Leveraged & Inverse
    • Managed Futures
    • Market Insights
    • Modern Alpha
    • Multifactor
    • Night Effect
    • Portfolio Strategies
    • Responsible Investing
    • Retirement Income
    • Richard Bernstein Advisors
    • Tax Efficient Income
  • Tools
    • ETF Screener
    • ETF Country Exposure Tool
    • ETF Sector Tracker Tool
    • ETF Database Categories
    • Head-To-Head ETF Comparison Tool
    • ETF Stock Exposure Tool
    • ETF Issuer Fund Flows
    • Indexes
    • Mutual Fund To ETF Converter
  • Research
    • ETF Education
    • Equity Investing
    • Dividend ETFs
    • Leveraged ETFs
    • Inverse ETFs
    • Index Education
    • Index Insights
    • Top ETF Sectors
    • Top ETF Issuers
    • Top ETF Industries
  • Webcasts
  • Themes
    • AI ETFs
    • Blockchain ETFs
    • See all Thematic Investing ETF themes
    • ESG Investing
    • Marijuana ETFs
  • Multimedia
    • ETF 360 Video Series
    • ETF of the Week Podcast
    • ETF Prime Podcast
    • Video
  • Company
    • About VettaFi
    • Get VettaFi’ed
  • PRO
    • Pro Content
    • Pro Tools
    • Advanced
    • FAQ
    • Pricing
    • Free Sign Up
    • Login
  1. ETF Scorecard – November 20 Edition
News
Share

ETF Scorecard - November 20 Edition

Kiril NikolaevNov 20, 2015
2015-11-20

To help investors keep up with the markets, we present our ETF Scorecard. The Scorecard takes a step back and looks at how various asset classes across the globe are performing. The weekly performance is from last Friday’s open to this week’s Thursday close.

  • U.S. markets ended in the green for the week.
  • All major foreign markets, including developed and emerging markets, are up for the week.
  • The Core Retail Sales report released last Friday a worse-than-expected growth of 0.2% m/m vs. the consensus of 0.4%.
  • The FOMC Meeting Minutes hawkish tone on Wednesday moved the market higher. This lowered investors’ uncertainty of whether a rate hike will occur, and gave them peace of mind that rates probably will rise in December as anticipated.
  • The leading indicator, Philly Fed Manufacturing Index was reported better than expected yesterday (Thursday) at 1.9 vs. the consensus of 0.1. This is a great sign for the U.S. economy since a reading above 0.0 means general business conditions are improving.
  • On the foreign side, notable news is that Japan has fallen into recession again.

For more ETF news and analysis, subscribe to our free newsletter.

Risk Appetite Review

  • U.S. equity markets have reversed this week, with all the major S&P 500 ETFs in the green.
  • The overall market as measured by the S&P 500 ETF (SPY A) was up by 2.06%.
  • The high-beta (SPHB B-) and low volatility (SPLV A+) ETFs are in the lead, with both up 2.68% for the week.
  • The equal-weight ETF (RSP B+) was the worst performer out of the bunch, with a 2.03% gain for the week.

Content continues below advertisement

Risk Appetite Review graph

Major Index Review

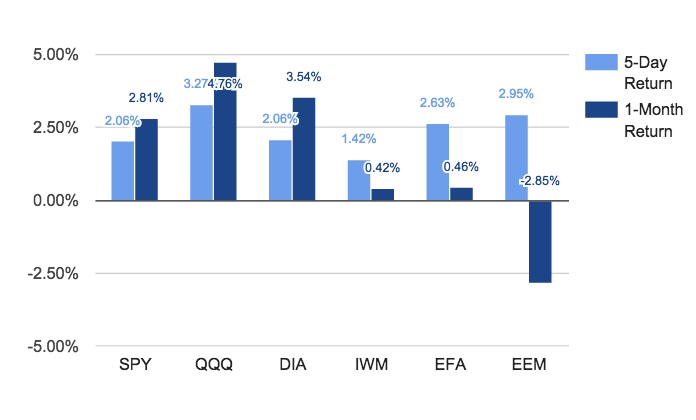
  • All major global indexes were up this week.
  • The Nasdaq 100 ETF (QQQ B+) is the best performer for the week and rolling month, with a 3.27% and 4.76% gain, respectively.
  • The Russell 2000 ETF (IWM A-) is the worst performer for the week, with only a 1.42% gain.
  • The outlier out of the group is the Emerging Markets ETF (EEM A-) since it’s the only ETF down at a 2.85% loss for the rolling month.
Major Index Review graph

Foreign Equity Review

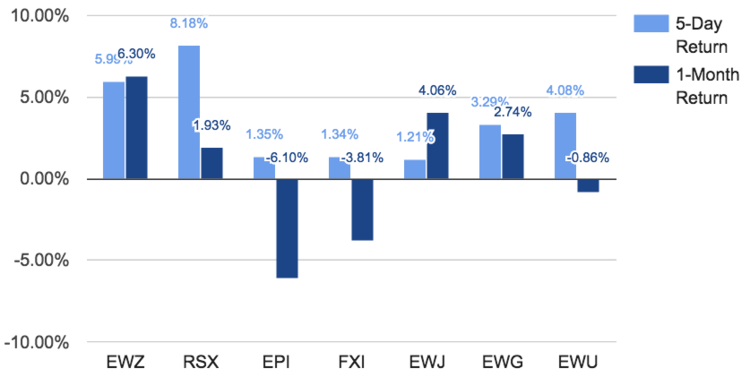
  • All major foreign equities are up for the week.
  • This time around, the Russian ETF (RSX B) is the best performer for the week, with an 8.18% gain.
  • The Brazilian ETF (EWZ A-) is the best performer for the rolling month, with a gain of 6.30%.
  • The Japanese ETF (EWJ A) is the worst performer for the week, with a 1.21% gain. This is mainly because of Japan again falling into recession.
  • The Indian ETF (EPI C+) remains the worst performer for the rolling month, with a 6.10% loss.
Foreign Equity Review graph

Commodities Review

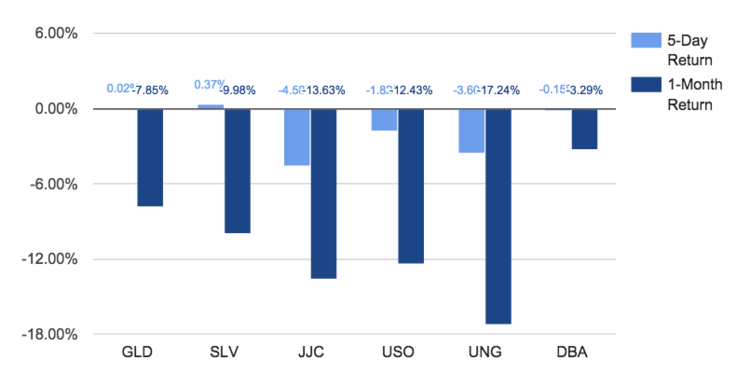
  • Commodities still are in the red for the week, except Gold (GLD A-) and Silver (SLV B-) with slight gains.
  • All commodities are down for the rolling month. This still is due to low inflation numbers and overall low global demand for commodities.
  • Copper (JJC A) is the worst performer for the week, with a loss of 4.58%.
  • For the rolling month, Natural Gas (UNG B-) continues to be the worst performer, with a huge loss of 17.24%.
Commodities Review graph

Currency Review

  • The U.S. dollar (UUP B) is down slightly for the week, with a 0.04% loss. Although, it is still the best performer for the rolling month, with a 4.42% gain.
  • The best performer for the week is the Australian Dollar (FXA B+) which gained 1.01%.
  • The Japanese Yen (FXY C) is the worst performing currency for the week, with a loss of 0.09%.
  • Most notably, the Euro (FXE A) is down the most for the rolling month at a loss of 5.62%.
Currency Review graph

For more ETF analysis, make sure to sign up for our free ETF newsletter.

Disclosure: No positions at time of writing.

» Popular Pages

  • Tickers
  • Articles

Jun 09

How Advisors Use the Small-Cap ETF 'QWST' in Portfolios

Jun 09

S&P 500: The Battle on Two Fronts

Jun 09

This Is How New Bulls Are Born

Jun 09

Main Management Market Note: June 9, 2023

Jun 09

European Carbon Allowances Up 10%: The Summer Guide

Jun 09

A Complete Comparison of Top U.S. Real Estate ETFs

Jun 09

Could Now Be a Good Time for Value ETFs?

Jun 09

Fine Tuning Your Index Exposure With Direct Indexing

Jun 09

BNDI Generates Better Returns, Yields in Core Bond Allocations

Jun 09

Issuer League: WisdomTree and Dimensional Are Up

QQQM

Invesco NASDAQ 100 ETF

VGT

Vanguard Information...

SPY

SPDR S&P 500 ETF Trust

FNGU

MicroSectors FANG+ Index 3X...

IWM

iShares Russell 2000 ETF

VUG

Vanguard Growth ETF

IYW

iShares U.S. Technology ETF

XLK

Technology Select Sector SPDR...

BOTZ

Global X Robotics &...

IVV

iShares Core S&P 500 ETF


Content continues below advertisement

Loading Articles...
Our Sites
  • VettaFi
  • Advisor Perspectives
  • ETF Trends
Tools
  • ETF Screener
  • Mutual Fund to ETF Converter
  • Head-To-Head ETF Comparison
  • ETF Country Exposure Tool
  • ETF Stock Exposure Tool
  • ETF Database Pro
More Tools
  • Financial Advisor & RIA Center
Explore ETFs
  • ETF News
  • ETF Category Reports
  • Premium Articles
  • Alphabetical Listing of ETFs
  • Browse ETFs by ETF Database Category
  • Browse ETFs by Index
  • Browse ETFs by Issuer
  • Compare ETFs
Information
  • Contact Us
  • Terms of Use and Privacy Policy
  • © 2023 VettaFi LLC. All rights reserved.

Advertisement

Is Your Portfolio Positioned With Enough Global Exposure?

ETF Education Channel

How to Allocate Commodities in Portfolios

Tom LydonApr 26, 2022
2022-04-26

A long-running debate in asset allocation circles is how much of a portfolio an investor should...

Core Strategies Channel

Why ETFs Experience Limit Up/Down Protections

Karrie GordonMay 13, 2022
2022-05-13

In a digital age where information moves in milliseconds and millions of participants can transact...

}
X