
News
To help investors keep up with the markets, we present our ETF Scorecard. The Scorecard takes a step back and looks at how various asset classes across the globe are performing. Because markets were closed on New Year’s Day, the weekly performance is from Monday’s open (instead of Friday’s open) to Thursday close.
- U.S. markets are down in the first week of the year.
- All major foreign markets, including developed and emerging markets, are bearish for the week.
- The spotlight this week is on the newly introduced circuit breakers on China’s Shanghai Composite exchange introduced on January 1. When the Shanghai Composite Index falls by more than 5% on a given day, trading ceases for 15 minutes. When it falls by 7% or more, this circuit breaker stops trading for the rest of the day. It was activated twice this week, on Monday and Thursday, which sent a global panic in the markets. Since the markets didn’t take this new development well, the circuit breaker has been discontinued going forward.
- Other news from China is the Caixin manufacturing PMI released on Sunday, which was a worse-than-expected figure of 48.2, compared to a consensus of 48.9. This triggered the early sell-off in the Chinese markets.
- On the domestic front, the leading economic indicator, ISM Manufacturing PMI, fell below expectation with the reported figure of 48.2 vs. the consensus of 49.1 on Monday’s release. This points to a slowdown in economic productivity.
- Further tensions between Iran and Saudi Arabia didn’t help the markets this week either; they may have magnified the volatility even more. In these conflicts, oil prices usually tend to increase; however, this was not the case this week. WTI oil hit a 12-year low to less than $33 a barrel.
For more ETF news and analysis, subscribe to our free newsletter.
Risk Appetite Review
- The overall market as measured by the S&P 500 ETF (SPY ) was down significantly this week, with a 3.21% decrease.
- The low volatility ETF (SPLV ) fell the least, by 2.05% for the week. This is because volatility was really high this week, and this ETF is designed to mitigate those extreme fluctuations.
- The high-beta ETF (SPHB ) is the outlier, with a huge loss of 6.47% for the week.
Content continues below advertisement

Major Index Review
- All major indexes are down more than 3% for the week and more than 7% for the month.
- Given the negative sentiment in the Chinese markets, it’s no wonder the Emerging Markets ETF (EEM ) is the worst performer for the week and the rolling month, with 4.85% and 11.11% losses, respectively.
- The smallest declines were in the S&P 500 (SPY ), with losses of 3.21% and 7.26% for the week and rolling month.

Foreign Equity Review
- All major foreign tracking ETFs are down for the week and rolling month.
- Again, it is clear the Chinese ETF (FXI ) is the worst performer for the week, with a loss of 6.41%.
- The Japanese ETF (EWJ ) fell the least for the week, with a loss of 1.68%.
- The Indian ETF (EPI ) is holding on and not doing as badly as the other emerging markets, with a loss of only 2.39% for the rolling month.
- With all the conflicts and sanctions in Russia, the Russian ETF (RSX ) continues to decline, and is the worst performer for the rolling month, with a loss of 19.41%.

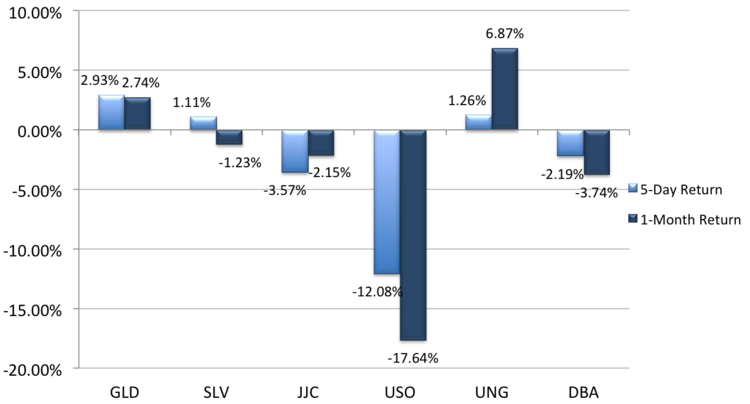
Commodities Review
- As mentioned earlier, oil is in decline this week, and is the outlier of the major commodities. The oil ETF (USO ) is down 12.08% and 17.64% for the week and rolling month, respectively.
- As global markets tumble this week, investors are looking for safety, which is the reason gold (GLD ) is the best performing commodity for the week, with a gain of 2.93%.
- Natural gas (UNG ) is the best performer for the rolling month, with a gain of 6.87%.
Currency Review
- The U.S. dollar (UUP ) is down for the week and rolling month, with declines of 0.55% and 0.74%, respectively.
- The Japanese yen (FXY ) has outperformed all other major currencies for the week and rolling month, with gains of 1.39% and 4.94%, respectively.
- The Australian dollar (FXA ) is the worst performer for the week and rolling month, with losses of 0.96% and 3.76%, respectively.

For more ETF analysis, make sure to sign up for our free ETF newsletter.
Disclosure: No positions at time of writing.

