News
To help investors keep up with the markets, we present our ETF Scorecard. The Scorecard takes a step back and looks at how various asset classes across the globe are performing. The weekly performance is from last Friday’s open to this week’s Thursday close.
- U.S. President Donald Trump will meet with his North Korean counterpart after all. The meeting with Kim Jong-un is set to take place on June 12 in Singapore and may extend into the second day if the two leaders decide they want to continue discussions. The U.S. hopes to achieve a verifiable commitment from North Korea to scrap its nuclear arsenal in exchange for economic benefits.
- The G7 summit is expected to kick off on June 8 in Canada with a big rift between the U.S. and the other six members over trade. The U.S. imposed tariffs on imports of aluminum and steel, prompting Canada, the European Union and Mexico to take retaliatory measures in a tit-for-tat battle that threatens to negatively impact the global economy.
- Amid trade war acrimony, the U.S. economy posted another strong employment report. The U.S. economy added 223,000 jobs in May, beating expectations by 33,000. Slightly deteriorating the employment picture, April’s figures were revised down by 5,000 to 159,000. Still, the unemployment rate fell to a record 3.8% from 3.9% previously, while average hourly earnings were up 0.3% on May month-over-month and 2.7% year-over-year.
- The U.S. manufacturing industry is on strong footing, with the ISM’s purchasing managers index (PMI) rising to 58.7 in May from 57.3 reported in April. Analysts had expected a May PMI of 58.5.
- ISM’s non-manufacturing PMI also rose in May compared to last month by almost two points to 58.6.
- Britain has finally received some good news after its Services PMI rose to 54 in May from 52.8 in the prior month.
- Crude oil inventories have increased by 2.1 million barrels for the week ended June 1, after a 3.6 million drop in the prior week. Of late, crude inventories have been whipsawing.
Risk Appetite Review
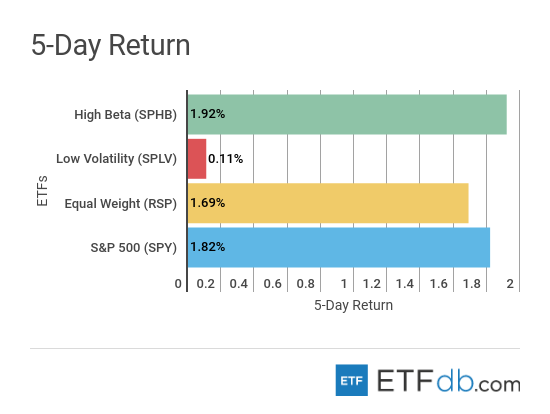
- Markets have had a good week, despite intensifying fears of a trade war between the U.S. and its allies.
- Riskier High Beta (SPHB ) advanced nearly 2%, making it the best performer.
- Low volatility (SPLV ) was the worst performer with a tepid gain of 0.11%.
- Lastly, the broad market (SPY ) edged up 1.82%.
Sign up for ETFdb.com Pro and get access to real-time ratings on over 1,900 U.S.-listed ETFs.
Content continues below advertisement
Major Index Review
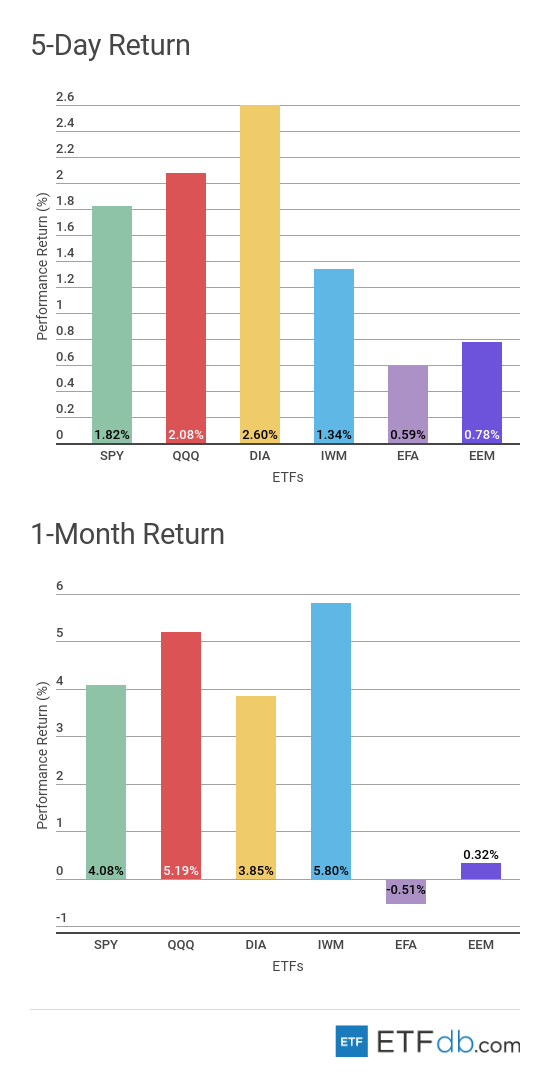
- Major indexes were all up.
- Surprisingly, Dow Jones (DIA ) was the best performer for the week, with an advance of 2.60%.
- International index (EFA ), heavy on Asian and European equities, was the worst performer with a 0.59% gain. (EFA ) also staged the biggest losses for the rolling month, down 0.51%.
- For the rolling month, the small-cap index (IWM ) remains the best performer as most of the firms included in the benchmark seem to be insulated from a potential trade war.
To see how these indices performed a week before last, check out ETF Scorecard: June 1 Edition
Sectors Review
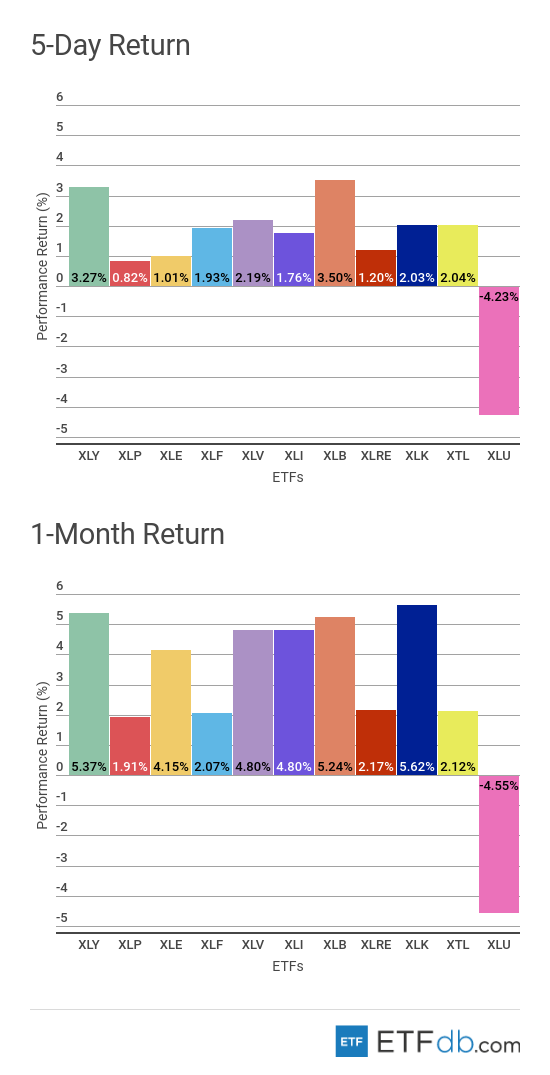
- Sectors were all up with one exception.
- In a rare feat, the materials sector (XLB ), which consists of companies such as DowDupont (DWDP) , and Monsanto (MON), was the best performer for the week with a rise of 3.5%.
- Utilities (XLU ) have posted the weakest performance, tumbling 4.23% for the week as investors flocked to riskier assets. Unsurprisingly, (XLU ) is also the worst performer for the rolling month, down 4.55%.
- For the rolling month, the technology sector (XLK ) remains the best performer with a rise of 5.62%.
Use our Head-to-Head Comparison tool to compare two ETFs such as (XLB ) and (XLK ) on a variety of criteria such as performance, AUM, trading volume and expenses.
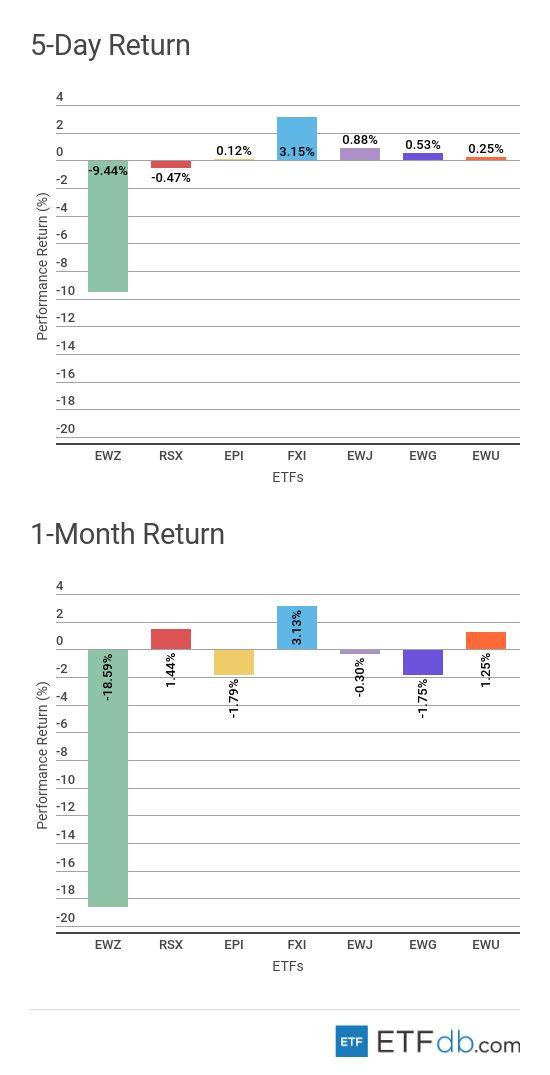
Foreign Equity Review
- Foreign equities were mixed.
- Brazil (EWZ ) was the worst performer both for the week and the rolling month, dropping a stunning 9.44% and 18.59%, respectively. The drop is a reaction to the government’s introduction of price controls for fuel after truckers staged a strike. This marks the return of Brazil’s government to populist policies after the unceremonious departure of former President Dilma Rousseff paved the way to a centrist government willing to implement market-friendly reforms. Polls also indicate that candidates from the extremist parties are leading in elections in October.
- The Chinese stock market (FXI ), meanwhile, was the best weekly performer with a rise of 3.15% as a deal between China and the U.S. on trade seems a likely possibility. (FXI ) is also the best performer for the rolling month, up 3.13%.
To find out more about ETFs exposed to particular countries, use our ETF Country Exposure tool. Select a particular country from a world map and get a list of all ETFs tracking your pick.
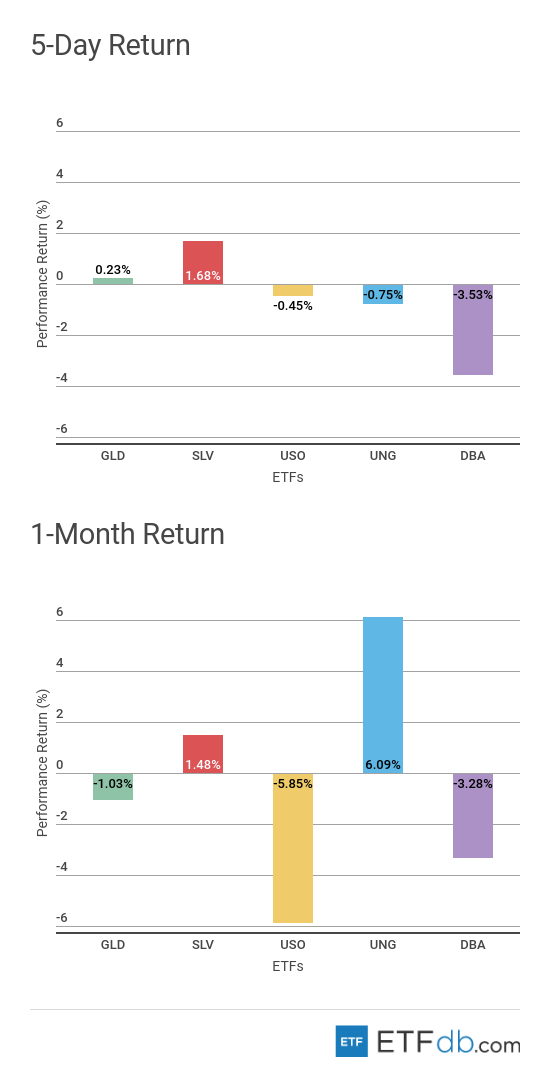
Commodities Review
- Commodities were mixed.
- Silver (SLV ) has gained 1.7% this week, representing the best performance from the pack.
- The Agriculture fund (DBA ) continued its losses this week, dropping 3.53%.
- Natural gas (UNG ) is up more than 6% for the rolling month, by far the best performance.
- Oil (USO ), meanwhile, is the worst performer for the month with a drop of 5.85%, as Saudi Arabia and Russia hinted that they may agree to increase supply to keep markets stable.
Currency Review
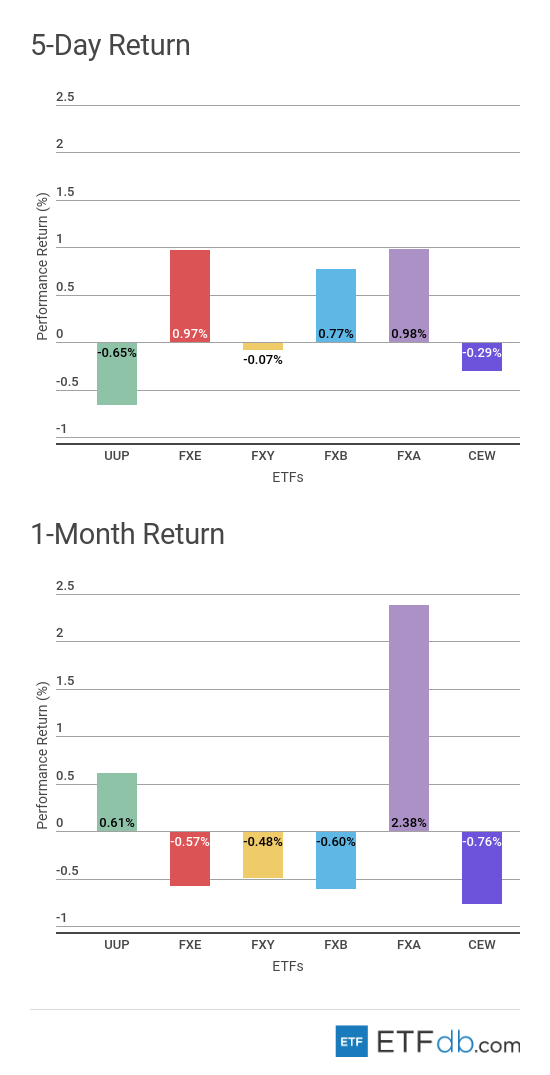
- Currencies posted mixed results.
- The Australian dollar (FXA ) has increased nearly 1% for the week, helped by a strong stock market in China and its potential trade deal with the U.S. (FXA ) is also the best performer for the rolling month, up 2.38%.
- The U.S. dollar (UUP ), meanwhile, posted losses of 0.65%, erasing some of the gains registered in previous weeks on the back of strong economic data.
- Emerging market currencies (CEW ) were the worst performers for the rolling month, losing 0.76% of their value. A dramatic fall in the Brazilian real contributed decisively to the basket’s poor performance.
For more ETF news and analysis, subscribe to our free newsletter.