To help investors keep up with the markets, we present our ETF Scorecard. The Scorecard takes a step back and looks at how various asset classes across the globe are performing. The weekly performance is from last Friday’s open to this week’s Thursday close.
- This week was rich in economic and geopolitical events, with the Federal Reserve’s monetary policy decision and the monumental summit between the U.S. and North Korean leaders taking center stage.
- U.S. President Donald Trump met with his North Korean counterpart Kim Jong-un this week, with both sides saying interactions were positive. Trump said the nuclear threat from North Korea was over, just a few months after the two leaders exchanged antagonistic words that worried global markets about a potential military dispute in the North Korean peninsula. North Korean media indicated that relief from economic sanctions was likely to happen soon, although U.S. Secretary of State Mike Pompeo made clear that will not happen until North Korea completes its nuclear disarmament.
- The U.S. Federal Reserve increased interest rates to 2% from 1.75% previously and took a slightly hawkish stance. Fed Chair Jerome Powell strongly indicated that there may be four hikes this year. In addition, Powell said that starting early next year, the Fed will hold press conferences each time after monetary policy meetings.
- Meanwhile, the European Central Bank said it would complete its 2.4 trillion bond-buying program at the end of this year and will likely start raising interest rates after September 2019. The central bank will cut the size of its monthly asset purchases to 15 billion euros after September and end the plan entirely by the end of the year.
- The G7 meetings sparked worries over global trade as the typically friendly summit revealed an increasing rift between the U.S. and its allies, including the European Union and Canada, over trade and global politics.
- U.K. manufacturing production unexpectedly dropped by 1.4% in April, in what was the third consecutive monthly decline. Analysts had expected an increase of 0.3%.
- U.S. consumer price index continued its advance in May, rising by 0.2%. On an annual basis, the CPI is up 2.8%, considerably above Fed’s target of 2%. Core CPI, meanwhile, is closer to the Fed’s aim, at 2.2%.
- U.K. inflation was stable in May, with CPI coming in at 2.4%. Since the beginning of the year in January, U.K. inflation has slowly fallen from 3%.
- Crude oil inventories dropped by 4.1 million barrels in the week ended May 8, after an increase in the prior week of 2.1 million. Inventories have whipsawed since mid-March.
- U.S. retail sales surged 0.8% in May, easily beating consensus estimates of 0.4%. Adding to the bright picture, retail sales for April were revised up to 0.4% from 0.3%. Core retail sales, i.e. less auto sales, were up 0.9%.
- U.S. jobless claims pointed to a strong labor market, coming in at 218,000. Analysts had predicted a higher reading of 224,000.
Risk Appetite Review
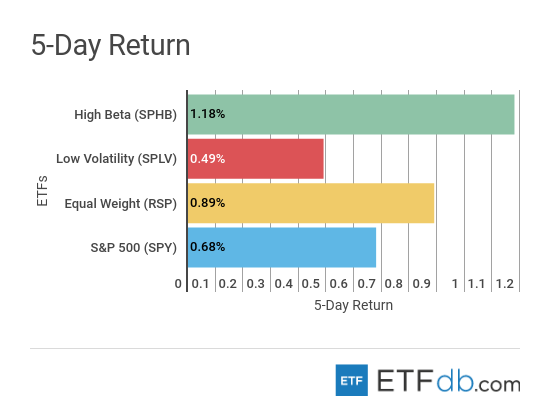
- Markets have continued their ascent this week.
- High Beta (SPHB ) was up 1.18%, the best performance from the pack.
- Low volatility (SPLV ), meanwhile, edged up just 0.49%, last in the list in terms of performance.
- The broad market (SPY ) increased 0.68% this week.
Sign up for ETFdb.com Pro and get access to real-time ratings on over 1,900 U.S.-listed ETFs.
Major Index Review
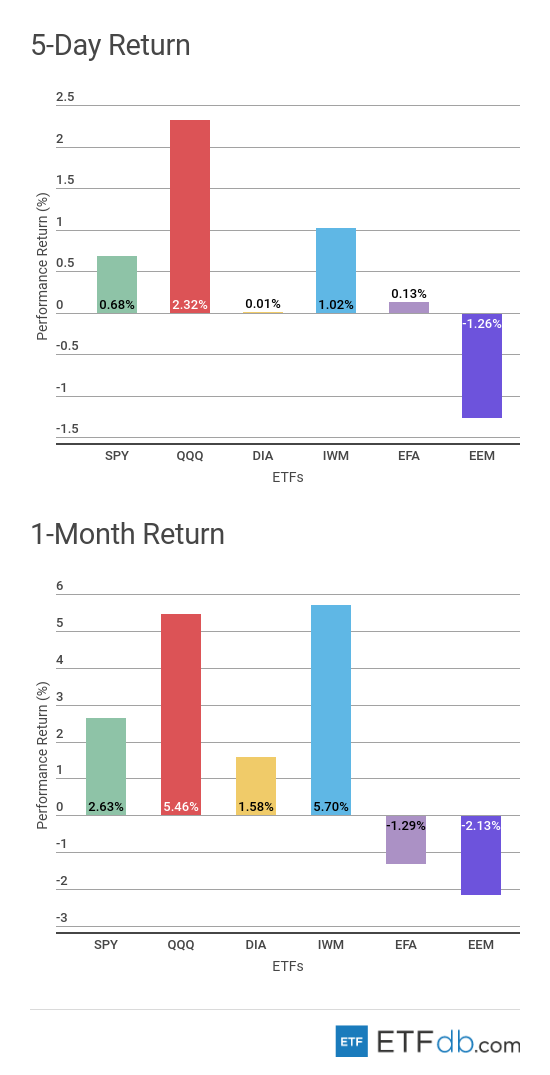
- Major indexes were all up with one exception.
- Technology stocks (QQQ ) gained 2.32% this week, by far the best performance from the pack, on the expectation of strong growth rates and as Facebook is leaving behind a data protection scandal.
- Emerging markets (EEM ) was the only faller this week, down 1.26%, due to a stronger dollar and the Federal Reserve’s hawkish signal. (EEM ) is also the worst performer for the rolling month, down 2.13%.
- The small-cap index (IWM ) remains the best performer this month, rising 5.7%, not far behind the technology index. The ascent is due to the index’s relative insulation from a potential trade war.
To see how these indices performed a week before last, check out ETF Scorecard: June 8 Edition
Sectors Review
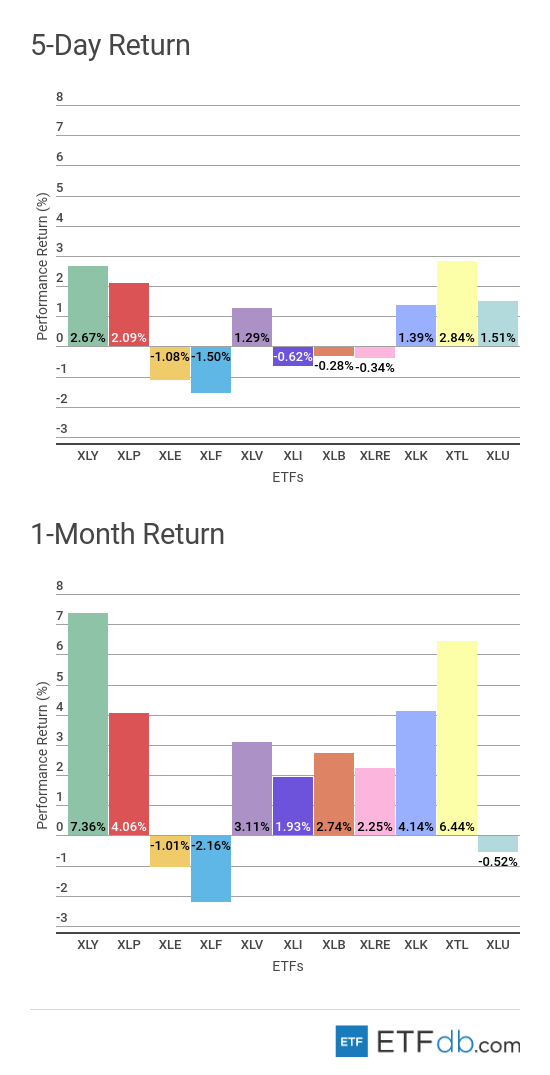
- Sectors were rather mixed.
- The telecom sector (XTL ) posted the best gains for the week, rising 2.84%, as a Judge approved a blockbuster deal between telecommunications firm AT&T (T) and content provider Time Warner (TWX).
- The financial sector (XLF ) was the worst slacker from the bunch this week, declining 1.50%. (XLF ) is also the worst performer for the month, down more than 2%.
- For the rolling month, the consumer discretionary sector (XLY ) was the best performer, advancing 7.36%, after months of underperformance due to falling sales and the Amazon threat.
Use our Head-to-Head Comparison tool to compare two ETFs such as (XLF ) and (XLY ) on a variety of criteria such as performance, AUM, trading volume and expenses.
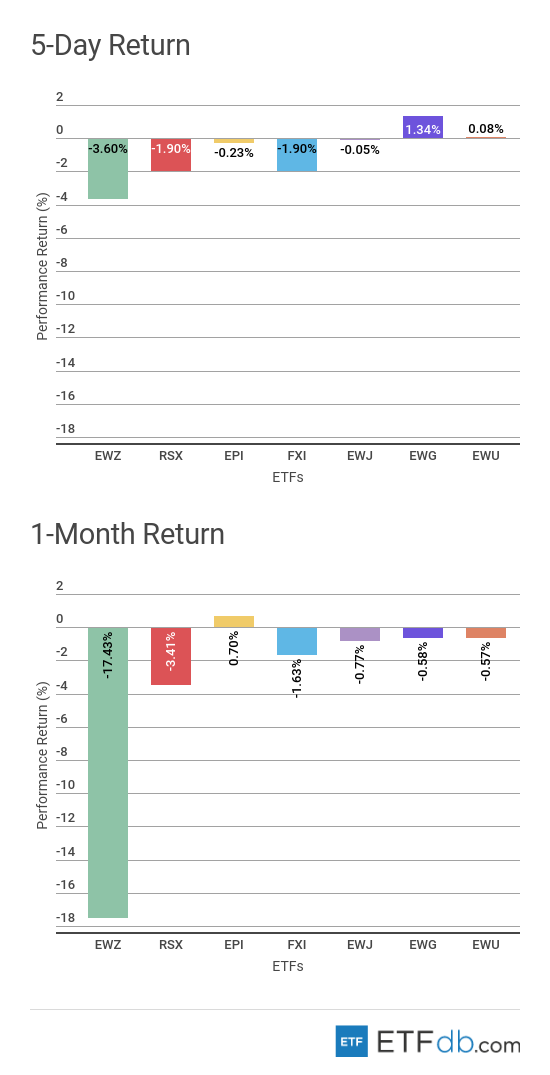
Foreign Equity Review
- Foreign equities were mixed.
- Brazil (EWZ ) continued its downward slide this week, falling by 3.60% as the company is grappling with a national strike by its truckers, which provoked shipping delays and risks throwing the economy into abyss. Unsurprisingly, (EWZ ) is also the worst performer for the rolling month, with a monumental drop of 17.43%.
- Germany (EWG ) is the best performer for the week with a rise of 1.34%, while India (EPI ) is the only gainer for the month, up 0.70%.
To find out more about ETFs exposed to particular countries, use our ETF Country Exposure tool. Select a particular country from a world map and get a list of all ETFs tracking your pick.
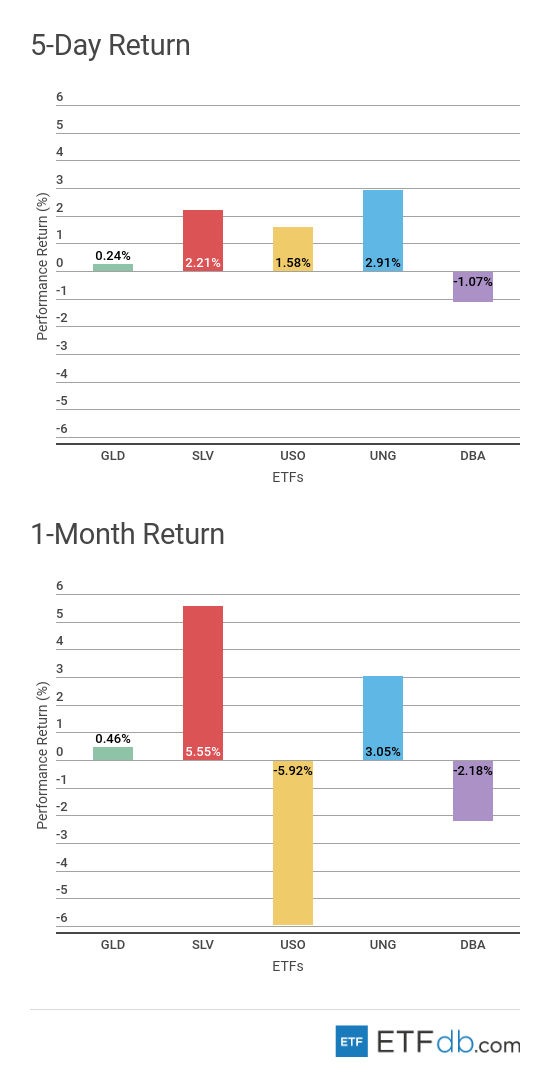
Commodities Review
- Commodities had a good week.
- Natural gas (UNG ) surged nearly 3% in the past five days, despite a bearish storage report showing a buildup of 96 billion cubic feet.
- The Agricultural fund (DBA ) fell more than 1% this week, representing the worst performance.
Currency Review
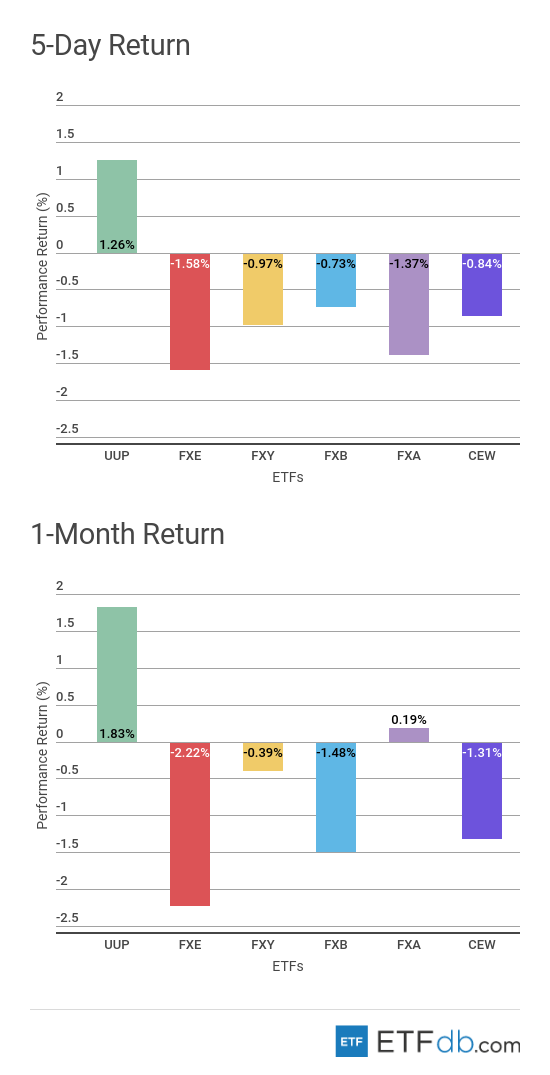
- Currencies were all down except for the U.S. dollar.
- The U.S. dollar (UUP ) advanced 1.26% this week as the Federal Reserve raised interest rates and transmitted a more hawkish stance on monetary policy. (UUP ) is up 1.83% for the past 30 days, which is the best performance.
- The European Central Bank said it would end its monetary stimulus program by the end of this year, but that has hardly helped the euro (FXE ), which is down 1.6% in the past five days. The euro is also the worst performer for the rolling month, down 2.22%.
For more ETF news and analysis, subscribe to our free newsletter.