To help investors keep up with the markets, we present our ETF Scorecard. The Scorecard takes a step back and looks at how various asset classes across the globe are performing. The weekly performance is from last Friday’s open to this week’s Thursday close.
- This week could easily be dubbed the week of central bankers. In addition to Bank of Japan and Bank of England publishing their monetary policy decisions, the ECB held its so-called Forum on Central Banking in Portugal, in what seems to be the European version of U.S. Jackson Hole.
- First and foremost, however, the political realm continued to drive economic news, with a trade spat between U.S. and China escalating. U.S. President Donald Trump threatened to impose tariffs on $200 billion worth of Chinese goods, while China labeled the action as “blackmailing.” The quarrel has raised the prospect of a full-blown trade war that threatens to derail the global economy.
- In a widely expected move, Bank of Japan kept its monetary policy steady, with interest rates maintained at minus 0.1%. Consumer inflation has been running below BoJ’s target of 2%, at between 0.7%.
- Bank of England has kept rates unchanged at 0.5%, but the policymakers conveyed a surprisingly hawkish tone. The officials voted to maintain the monetary policy unchanged by 6 to 3 compared to 7 to 2 expected by the market. The bank’s chief economist Andy Haldane joined the ranks of dissenters, believing the bank should raise rates.
- In an interesting panel at the Forum on Central Banking, ECB’s Mario Draghi said factors that are holding inflation at low levels are slowly waning and reiterated his confidence that inflation will eventually reach its goal of 2%. Meanwhile, BoJ’s Haruhiko Kuroda supported a government initiative calling for employers to raise salaries by 3% a year in order to give the central bank a chance to reach its target. While most of the developed world is tackling low inflation, Fed Chair Jerome Powell assured investors that a 1970’s style inflation in the U.S. is unlikely despite a strong labor market.
- U.S. building permits for May of 1.30 million were slightly lower than analysts had expected. In the prior month, permits came in at 1.36 million. Housing starts pointed to a brighter picture of the housing industry. Starts for May stood at 1.35 million compared to 1.29 million in the prior month.
- U.S. existing home sales fell slightly in May, from 5.45 million to 5.43. However, economists had forecast an expansion to 5.52 million.
- Crude oil inventories fell for the second consecutive week, down 5.9 million barrels for the five-day period ended June 15. In the prior week, stockpiles dropped by 4.1 million barrels.
- Unemployment claims continue to head down. Around 218,000 people filed for unemployment insurance in the week ended June 16, 3,000 less compared to the prior week.
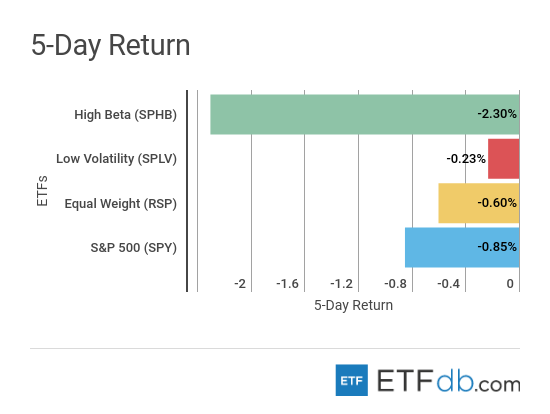
Risk Appetite Review
- Amid trade war threats, investors have looked for safe havens.
- Low volatility (SPLV ) is the best performer for the week with a small drop of 0.2%.
- High beta (SPHB ) was down 2.3%, trimming some of the strong gains it registered in previous weeks.
- The broad market (SPY ) fell 0.85%.
Sign up for ETFdb.com Pro and get access to real-time ratings on over 1,900 U.S.-listed ETFs.
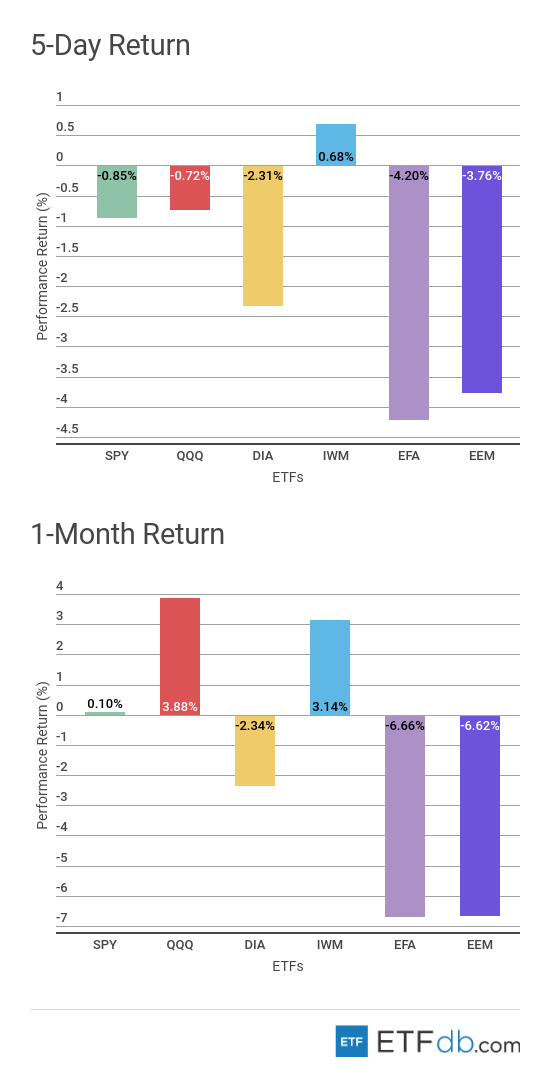
Major Index Review
- Major indexes were all up with a single exception.
- The small-cap index (IWM ) has risen 0.68% in the past five days, the only one from the pack to post positive gains. (IWM )’s limited exposure to international trade has helped it become a relative safe haven.
- The developed market index (EFA ), which includes European and Australasian equities, was the worst performer both for the week and the rolling month, down 4.20% and 6.66%, respectively. The countries in the index, which include China and Germany, are expected to suffer from a potential trade war.
- For the rolling month, the technology index (QQQ ) remains the best performer with a rise of 3.88%.
To see how these indices performed a week before last, check out ETF Scorecard: June 15 Edition
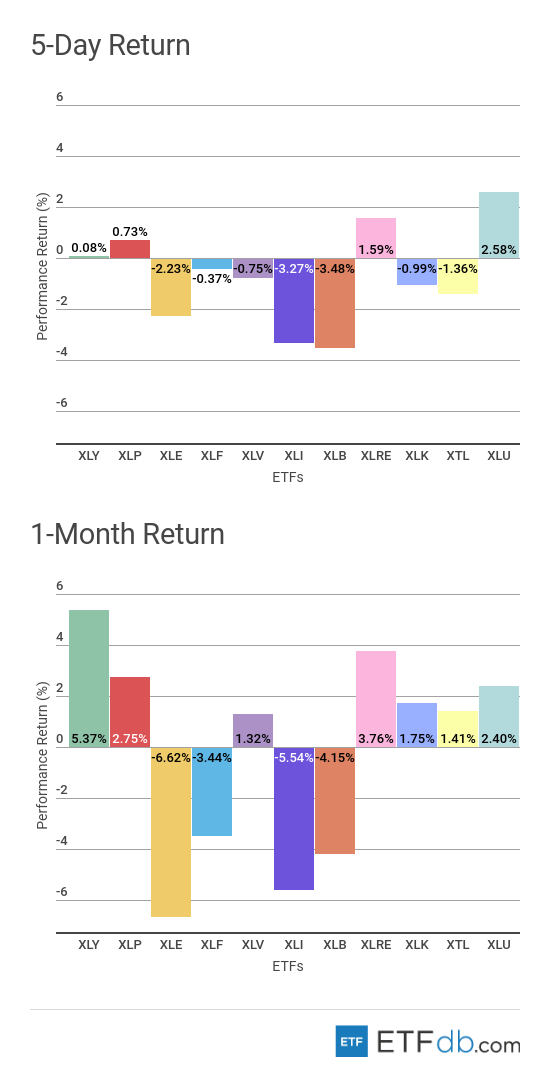
Sectors Review
- Sectors were rather mixed.
- Utilities (XLU ) have benefited from their safe-haven status in this fear-driven environment, surging 2.58% in the past week.
- The materials sector (XLB ), which is the most exposed to trade war threats, has dropped 3.48% in the last five days.
- The consumer discretionary sector (XLY ) is surprisingly the best performer for the rolling month, recouping some losses as investors believed the sell-off was overdone.
- As the Organization of the Petroleum Exporting Countries (OPEC) is close to reaching a deal to raise supplies, the energy sector (XLE ) posted the worst monthly performance, down 6.62%.
Use our Head-to-Head Comparison tool to compare two ETFs such as (XLU ) and (XLY ) on a variety of criteria such as performance, AUM, trading volume and expenses.
Foreign Equity Review
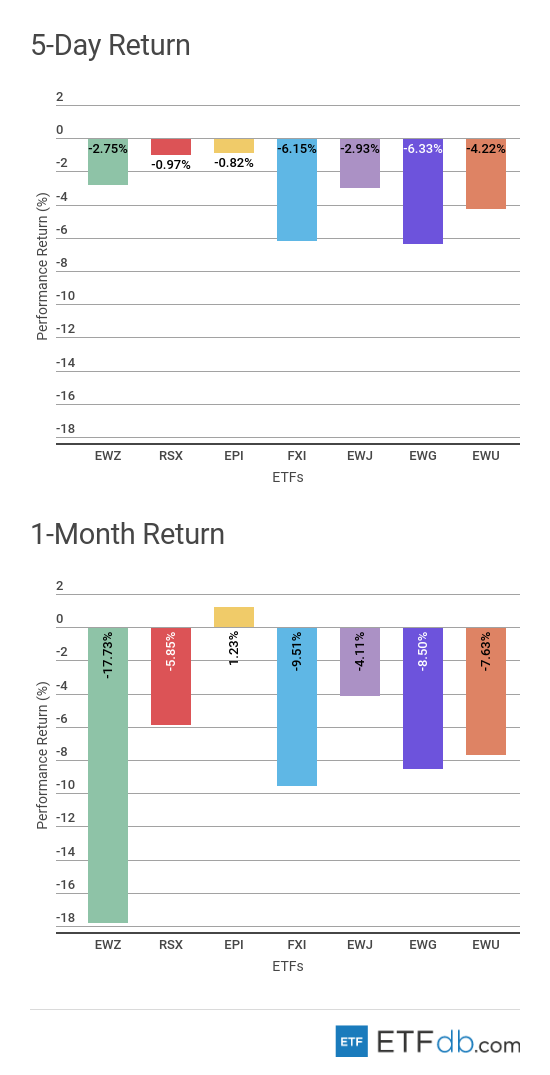
- Foreign equities were all down.
- Germany (EWG ) has dropped the most this week, posting losses of 6.3%. The components of the German index have heavy global exposure, with more than half of the sales coming from abroad. A potential trade war would hit a lot of companies, ranging from industrial conglomerates to car makers.
- India (EPI ) is viewed as relatively insulated from the global trade jitters, although it still declined by 0.82%. India is the only gainer for the rolling month, up 1.23%.
- Brazil (EWZ ) remains the worst performer for the rolling month, tumbling 17.73%, due to risks the country will revert to populist policies.
To find out more about ETFs exposed to particular countries, check out our ETF Country Exposure tool. Select a particular country from a world map and get a list of all ETFs tracking your pick.
Commodities Review
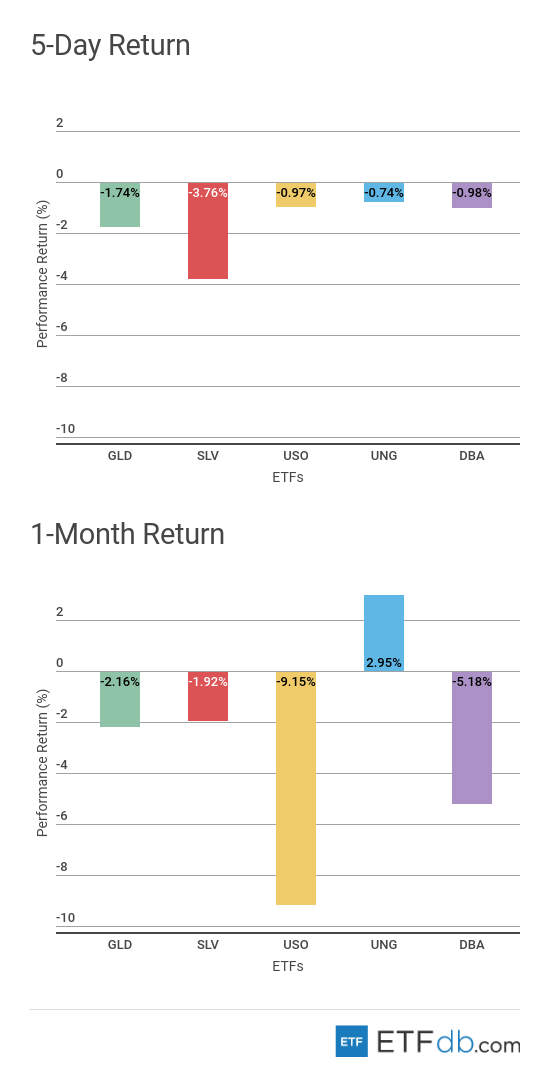
- Commodities were all down on surprisingly low volatility.
- Natural gas (UNG ) is the best performer with a decline of 0.74%. (UNG ) is also the best performer for the rolling month and the only gainer, up 2.95%.
- Silver has not benefited from its safe-haven status this week, tumbling nearly 4%.
- Oil (USO ) has swooned more than 9% in the past 30 days as OPEC is close to reaching a deal to increase output to keep markets stable.
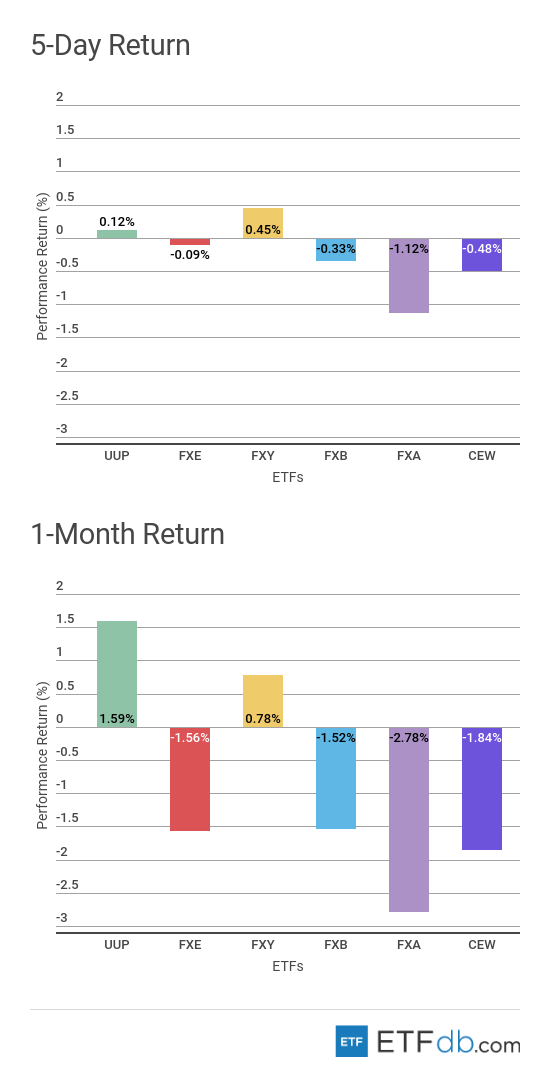
Currency Review
- Currencies were mixed.
- The Japanese yen (FXY ) has gained because of a rush to safe havens, but only a little. The currency has advanced 0.45% in the past five days and is also the best performer for the rolling month, up 0.78%.
- The Australian dollar (FXA ) is the worst performer both for the week and the rolling month, down 1.12% and 2.78%, respectively.
For more ETF news and analysis, subscribe to our free newsletter.