To help investors keep up with the markets, we present our ETF Scorecard. The Scorecard takes a step back and looks at how various asset classes across the globe are performing. The weekly performance is from last Friday’s open to this week’s Thursday close.
- This week was marked by ongoing jitters in the market due to heightening tensions over the possibility of a trade war between the U.S. and China – the world’s two largest economies – and the OPEC meetings.
- Last Friday, the Organization of the Petroleum Exporting Countries (OPEC) reached an agreement to expand crude oil output by lifting production caps on the cartel’s members. The expected output increase, however, is smaller than the market had expected.
- A host of European services and manufacturing purchasing managers’ indexes (PMI) have indicated the European economy is expanding, although Germany’s manufacturing capability is no longer the engine. German flash manufacturing PMI dropped from 56.9 to 55.9 in June.
- Germany’s business climate has deteriorated this month, with an index compiled by the Institute for Economic Research dropping from 102.3 to 101.8. The decline, however, was in line with expectations.
- U.S. consumer confidence declined in June from 128.8 to 126.4 as the trade war worries have taken a toll. Analysts had forecast the index to fall to 127.6.
- U.S. durable goods orders declined by 0.6% in June, beating analysts’ expectations of a 0.9% drop. In the prior month, orders swooned by 1.6%. Core durable goods, i.e. without volatile transportation items, were down 0.3% compared to a 0.5% rise predicted by pundits. In the prior month, core orders were upwardly revised by 1.9%.
- Perhaps the biggest surprise this week was delivered by the oil inventory report. For the week ended June 22, U.S. crude stocks decline by an incredible 9.9 million barrels, the third consecutive weekly drop. Analysts had forecast a decline of 2.4 million barrels.
- The final estimate for the U.S. GDP disappointed woefully. The Bureau of Economic analysis said first-quarter output increased by 2%, as much as 20 basis points lower than the previous estimate.
- Unemployment claims, however, continued to signal a strong labor market in the U.S. For the week ended June 23, around 227,000 individuals filed for unemployment insurance, 9,000 higher than the prior week.
Risk Appetite Review
- The stock market decline continued this week amid an ongoing trade spat between China and the U.S.
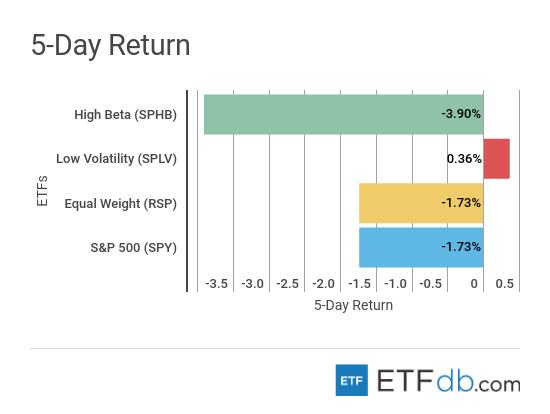
- Low volatility (SPLV ) is again the best weekly performer and is the only asset to post positive gains, up 0.36%.
- High Beta (SPHB ) tumbled nearly 4% in what was a clear flight from risky assets.
- The broad market (SPY ) dropped by 1.73% on fears a trade war will hurt the global economy.
Sign up for ETFdb.com Pro and get access to real-time ratings on over 1,900 U.S.-listed ETFs.
Major Index Review
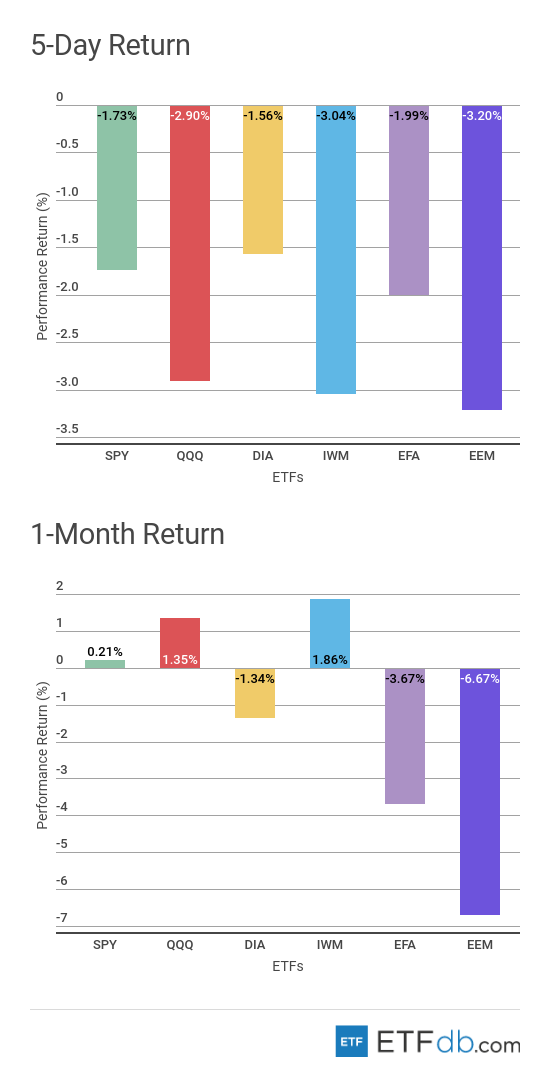
- Major indices were all down.
- Surprisingly, Dow Jones (DIA ) posted the smallest losses, down 1.56%, as U.S. President Donald Trump backed away from imposing a crackdown on Chinese investment in the U.S.
- Emerging markets (EEM ) were hit the most this week, declining by 3.2%. Big losses in the Chinese and Indian stock markets contributed decisively to the ETF’s poor performance. Emerging markets are also the worst performer for the rolling month, down as much as 6.7%.
- Technology equities (QQQ ) remain one of the best performers for the rolling month, although they lost some of their shine this week. (QQQ ) is up 1.35% for the rolling month.
To see how these indices performed a week before last, check out ETF Scorecard: June 22 Edition
Sectors Review
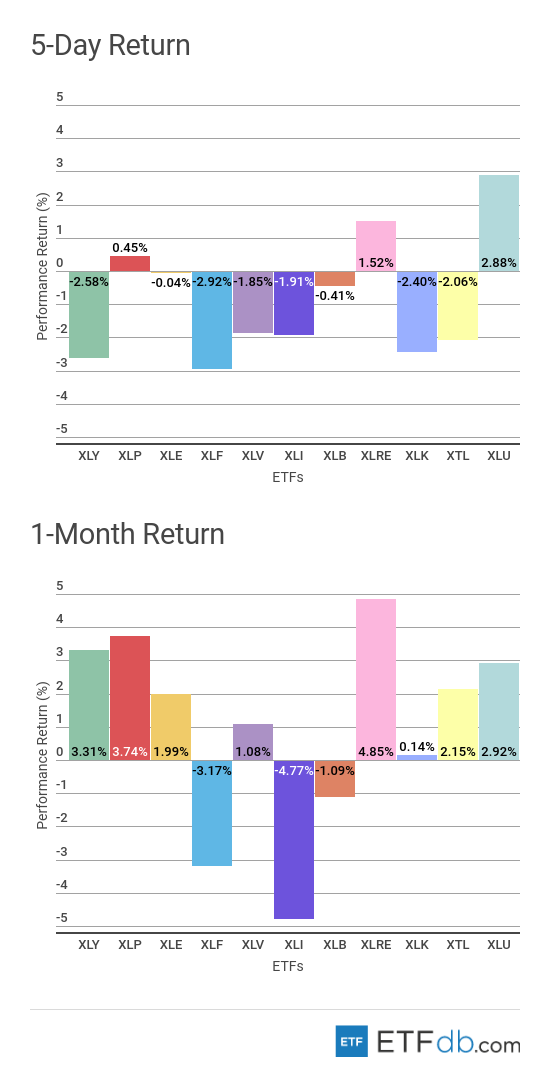
- Sectors were all down with a few exceptions.
- Utilities (XLU ) have continued their upward advance this week as investors fear a full-blown trade war between the U.S. and China. (XLU ) has risen nearly 3%.
- The financial sector (XLF ) is the worst performer for the week, down 2.92%.
- For the rolling month, however, industrials (XLI ) are the worst performers as they stand to lose much in a trade war. (XLI ) dropped by 4.77%.
- For the rolling month, the real estate sector (XLRE ) is the best performer with an impressive rise of 4.85%.
Use our Head-to-Head Comparison tool to compare two ETFs such as (XLF ) and (XLRE ) on a variety of criteria such as performance, AUM, trading volume and expenses.
Foreign Equity Review
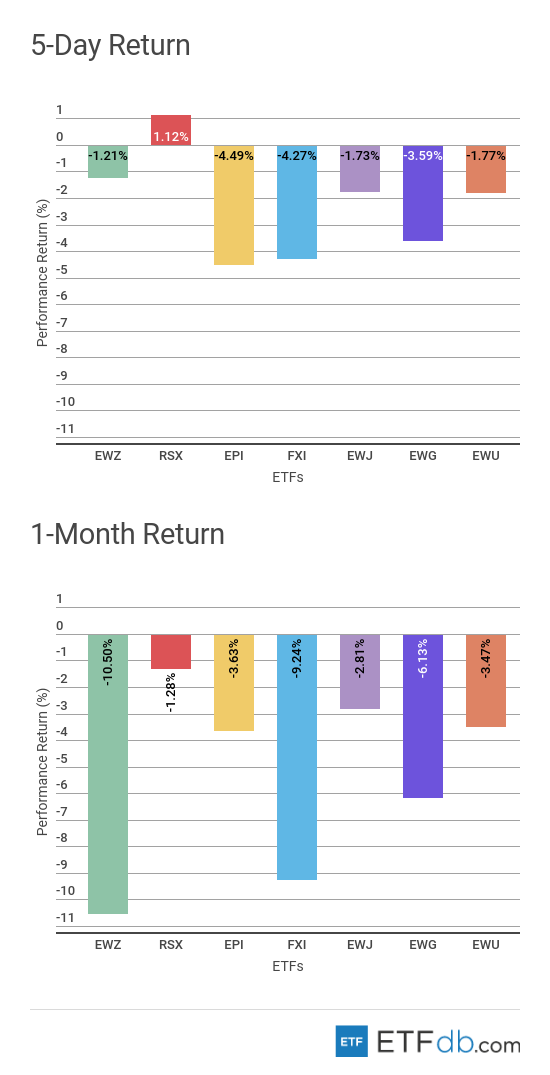
- With the exception of Russia, foreign equities were all down this week.
- Russia (RSX ) advanced 1.12% this week, largely thanks to increasing oil prices as U.S. stockpiles dropped consistently this week. As a result, Russia is also the best performer for the rolling month, down only 1.28%.
- India (EPI ) has finally cracked under pressure from trade war fears, after weeks of appearing strong-footed. (EPI ) is the worst performer for the week, down as much as 4.5%.
- Brazil (EWZ ) failed to reverse previous losses this week and remains down by more than 10%.
To find out more about ETFs exposed to particular countries, use our ETF Country Exposure tool. Select a particular country from a world map and get a list of all ETFs tracking your pick.
Commodities Review
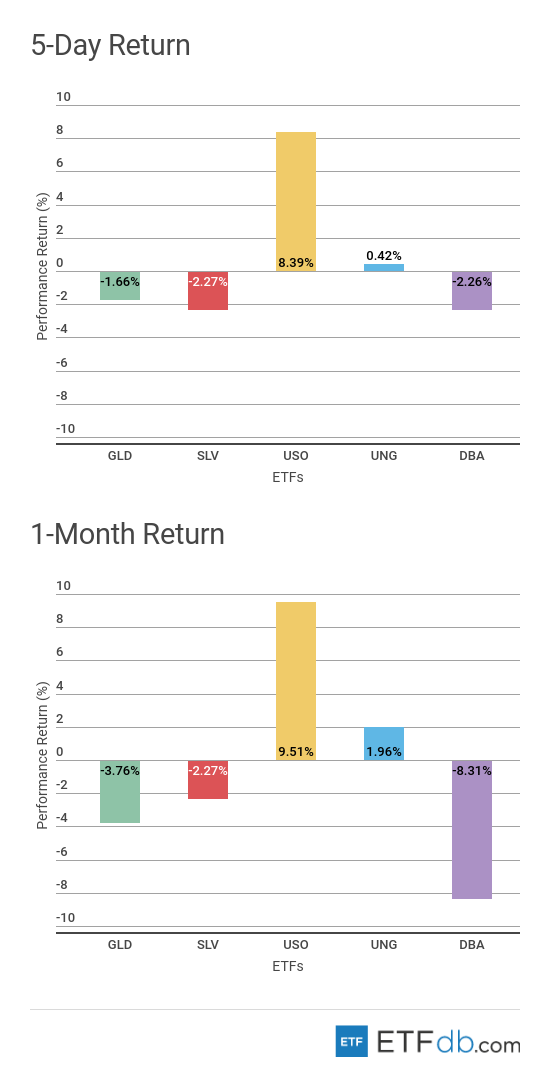
- Commodities were mixed.
- Crude oil (USO ) shot up as much as 8.4% this week as the OPEC agreement to increase supply coupled with a strong drawdown in U.S. inventories put upward pressure on prices. Unsurprisingly, oil is the best performer for the rolling month, up 9.51%.
Currency Review
- Currencies were mixed.
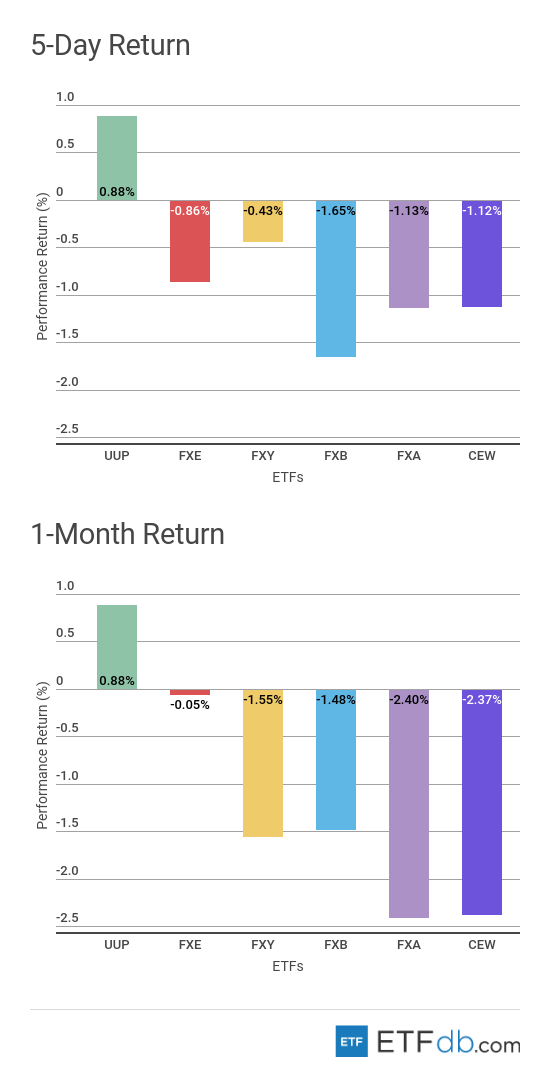
- The U.S. dollar (FXY ) continued to appreciate this week, advancing 0.9%. The greenback also maintained its status of best monthly performer with an advance of 0.88% in the past 30 days.
- The British pound (FXB ), meanwhile, is the worst weekly performer with a drop of 1.65%.
- The Australian dollar (FXA ) continues to be the worst monthly performer with a drop of 2.40%.
For more ETF news and analysis, subscribe to our free newsletter.