To help investors keep up with the markets, we present our ETF Scorecard. The Scorecard takes a step back and looks at how various asset classes across the globe are performing. The weekly performance is from last Friday’s open to this week’s Thursday close.
- This week was all about Germany’s political debacle, which risks toppling Angela Merkel’s government and leading to a breakup of the European Union. A bank holiday in the U.S. due to Independence Day also meant the week was weak in economic data.
- Fears about European Union disintegration have risen after German Chancellor Angela Merkel outlined a plan to control immigrants at borders in order to keep her alliance together. Although it is a small step, the move may lead other European countries to close borders, effectively putting an end to Europe’s open borders policy. The reaction in the markets was rather muted, as economic integration is unlikely to suffer as a result.
- U.K. central bank Governor Mark Carney strongly indicated in a speech held in Newcastle that interest rates may be hiked soon, saying the British economy was on strong footing.
- Indeed, Britain’s final GDP figure for the first quarter came in higher than expected, posting growth of 0.2% quarter over quarter compared to 0.1% estimated previously.
- Inflation in the eurozone came out at 2% in June compared to 1.9% in the prior month, hitting the central bank’s target. However, the ECB has little reason to cheer given that core inflation is just 1%. Energy prices had the biggest impact on the consumer price index, rising 8% in June compared to the same month last year.
- U.S. manufacturing is booming, according to a purchasing managers index compiled by the Institute for Supply Management. The PMI rose to 60.2 in June from 58.7 in the prior month. Analysts had expected the PMI to drop to 58.2.
- The U.S. economy added 177,000 jobs in June, according to an ADP report, marking a slight fall compared to the prior month. Analysts had forecasted 190,000 jobs.
- Unemployment numbers were above expectations, although still hovering near all-time lows of 231,000 for the week ended June 30.
- After an abrupt fall in the June 22 week, crude oil inventories recovered the following five-day period, adding 1.2 million barrels.
Risk Appetite Review
- The stock market finally reversed some of the losses this week.
- Low volatility (SPLV ) remains the strongest performer from the bunch, up 1.06%.
- High Beta (SPHB ) registered small gains for the week and is the worst performer.
Sign up for ETFdb.com Pro and get access to real-time ratings on over 1,900 U.S.-listed ETFs.

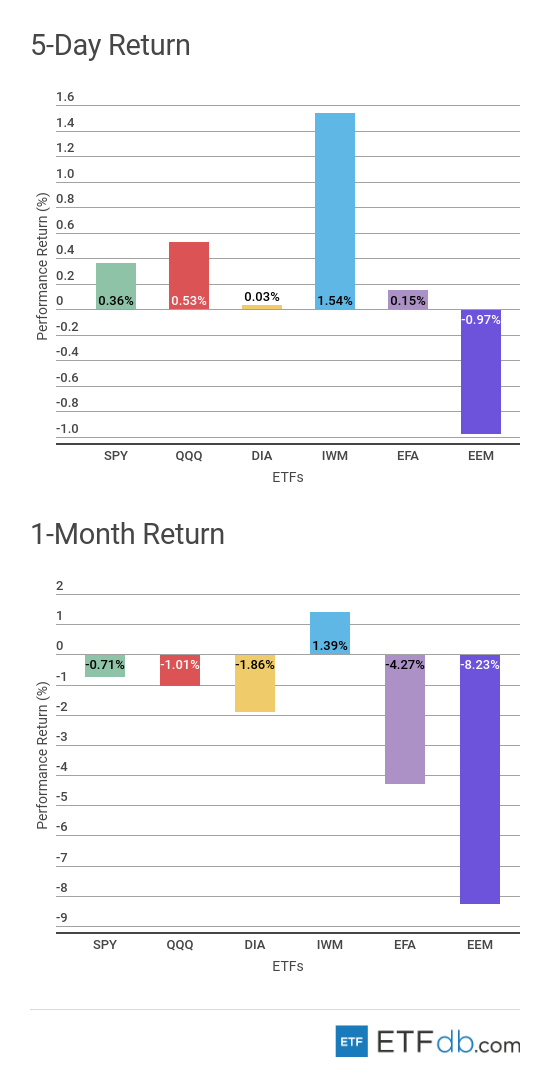
Major Index Review
- Major indexes were mixed.
- Small-cap stocks (IWM ) have again claimed the crown of the best weekly performer with an advance of 1.54%, as investors flock to assets that have low exposure to the trade war. (IWM ) is also the best performer for the rolling month and the only gainer, up 1.39%.
- Emerging markets (EEM ) have suffered from a strong dollar of late and the ongoing trade war. U.S. President Donald Trump imposed tariffs on $34 billion worth of Chinese goods, prompting the Asian country to threaten retaliation. (EEM ) is the worst performer both for the week and the rolling month, down 0.97% and 8.23%, respectively.
To see how these indices performed a week before last, check out ETF Scorecard: June 29 Edition
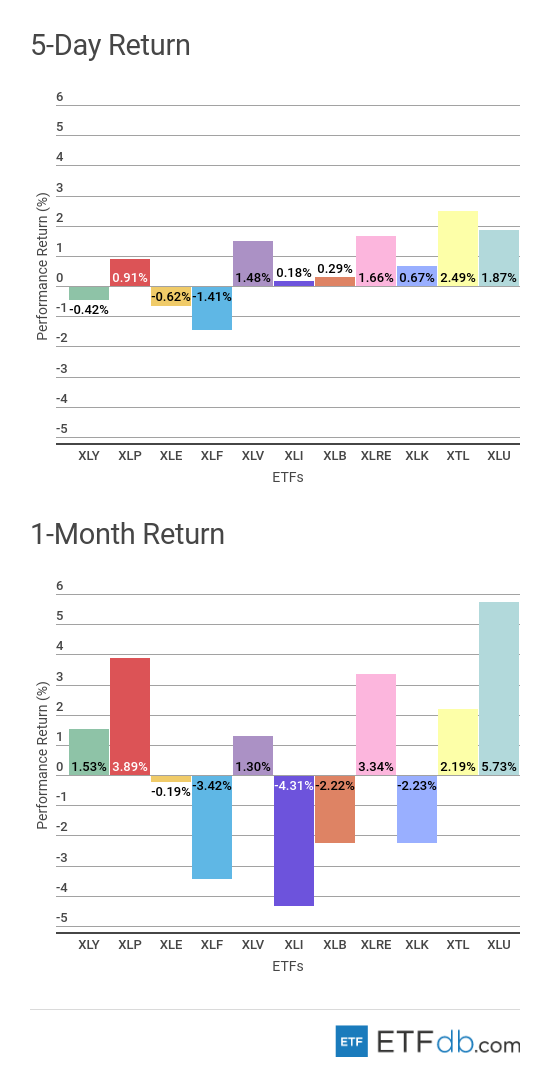
Sectors Review
- Sectors were rather mixed.
- Telecom (XTL ) stocks were the best performers this week.
- Meanwhile, the financial sector (XLF ) is the worst weekly performer and one of the few fallers, as many banks are undergoing Federal Reserve stress tests. (XLF ) is down 1.41%.
- Utilities (XLU ) remain the biggest gainers for the month, up 5.73%, as the sector is preferred by investors for its stability amid rising concerns about global trade.
- The industrial sector (XLI ) has dropped 4.31% for the month.
Use our Head-to-Head Comparison tool to compare two ETFs such as (XLI ) and (XTL ) on a variety of criteria such as performance, AUM, trading volume and expenses.
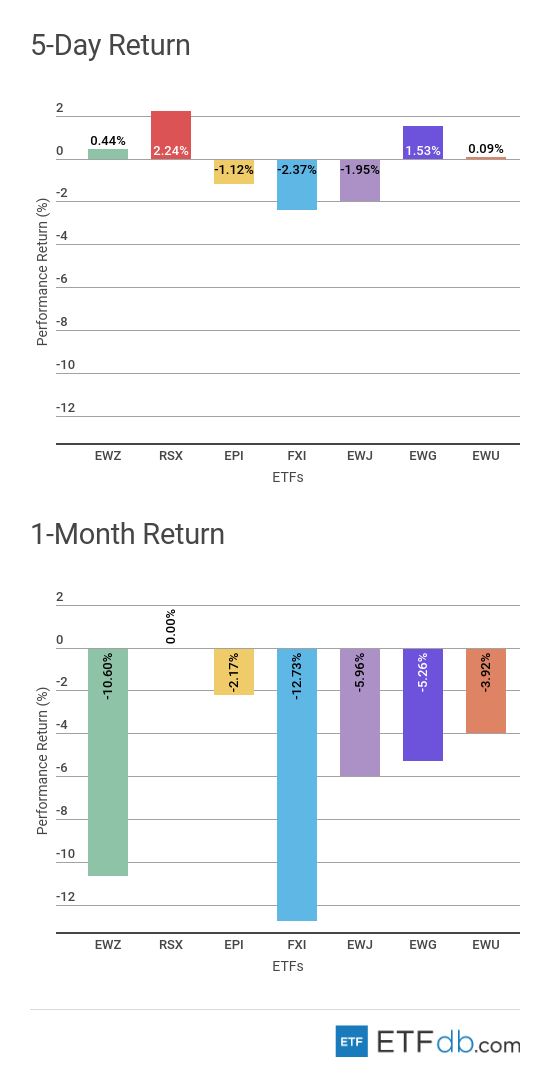
Foreign Equity Review
- Foreign equities were mixed.
- Russia (RSX ) continues to outperform its peers. (RSX ) has risen by 2.24% this week, helping it become the best performer for the rolling month with flat gains.
- China (FXI ) is the worst performer both for the week and the rolling month, as a trade war with the U.S. officially started after the U.S. administration imposed its first round of tariffs. (FXI ) dropped 2.37% in the past five days, extending monthly losses to 12.73%.
To find out more about ETFs exposed to particular countries, use our ETF Country Exposure tool. Select a particular country from a world map and get a list of all ETFs tracking your pick.
Commodities Review
- Commodities were mixed.
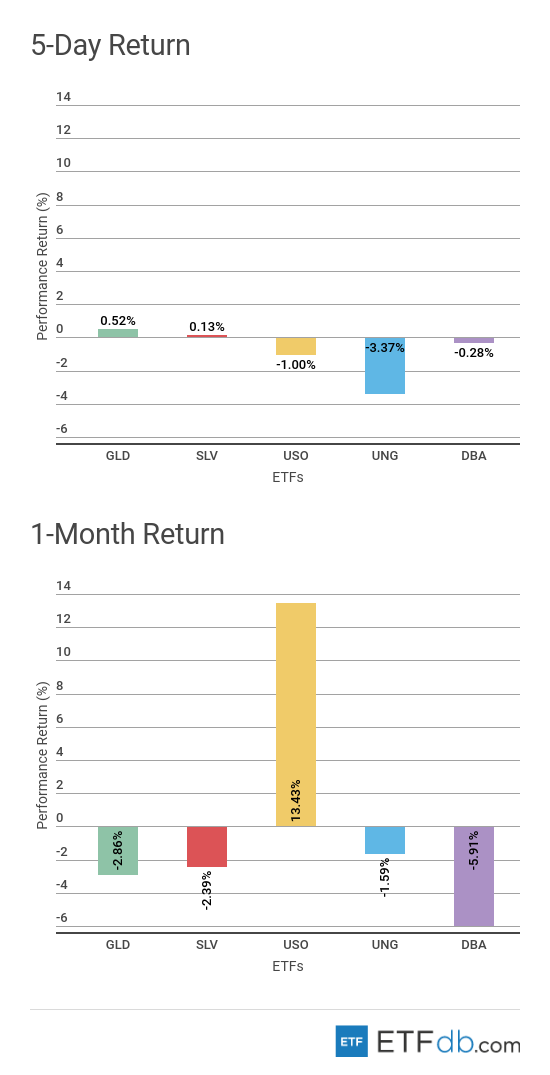
- Gold (GLD ) is the best performer for the week with tepid gains of 0.52%, as the shiny commodity benefited a little from its safe-haven status.
- Natural gas (UNG ) is the worst weekly performer, recording losses of 3.37%.
- Oil (USO ) is the best performer for the rolling month with an impressive rise of 13.4%.
- The Agricultural fund (DBA ), meanwhile, posted the weakest monthly performance with a drop of nearly 6%.
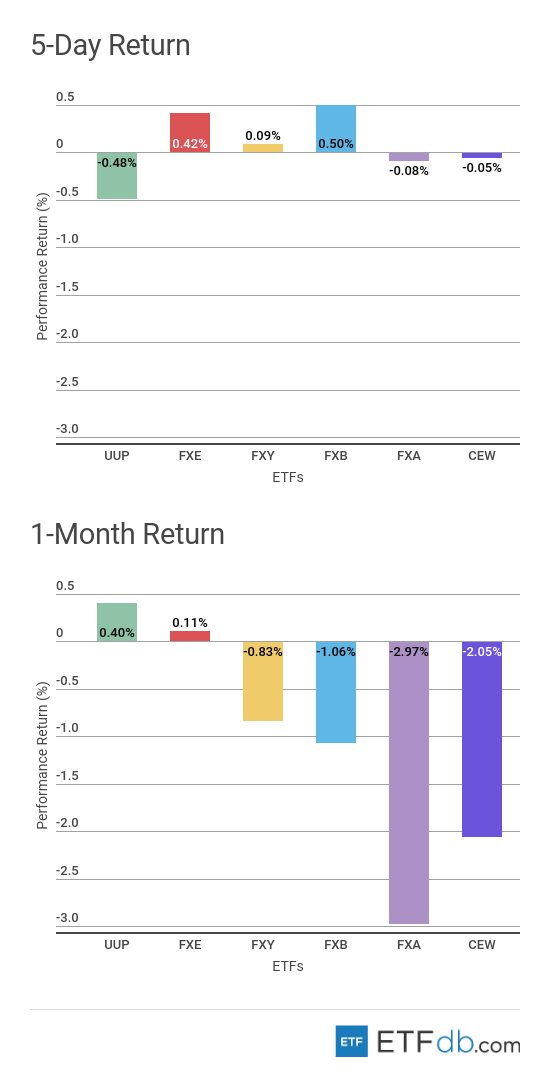
Currency Review
- Currencies were mixed.
- The U.S. dollar (UUP ) has given up some of its previous week’s gains, dropping by 0.50% this week. However, the greenback is still the best performer for the rolling month with a rise of 0.40%.
- The British pound, (FXB ), meanwhile, is the best weekly performer with a rise of 0.50% as Bank of England Governor Mark Carney indicated interest rates may be raised soon.
- The Australian dollar, (FXA ) is the worst performer for the rolling month, down 2.97%.
For more ETF news and analysis, subscribe to our free newsletter.