To help investors keep up with the markets, we present our ETF Scorecard. The Scorecard takes a step back and looks at how various asset classes across the globe are performing. The weekly performance is from last Friday’s open to this week’s Thursday close.
- President Donald Trump has worried both Republicans and allies after making strong remarks about the low defense spending of NATO members, triggering fears the U.S. may seek to dismember the 29-state alliance. Other NATO members, including Britain, made clear the alliance was indispensable.
- After slapping tariffs on $30 billion worth of Chinese imports, the Trump administration said it was preparing another package of levies targeting $200 billion of Chinese goods.
- Amid fears of NATO and European Union breakups and trade wars, the U.S. economy is ploughing ahead. Around 213,000 jobs were added in June, higher compared to analysts’ estimates of 195,000. The figure for May was revised up to 244,000. The unemployment rate increased from 3.8% to 4%, indicating U.S. workers are still continuing to join the job market in greater numbers. Average hourly earnings disappointed, coming in at 0.2% compared to 0.3% expected by analysts.
- U.K. manufacturing production increased by 0.4% month-over-month in May, disappointing expectations of a 1% rise. In the prior month, output fell by 1.3%.
- Germany’s ZEW economic sentiment, an index based on surveyed German institutional investors and analysts, is in negative territory for the fourth consecutive month. The July sentiment worsened to negative 24.7 from negative 16.1 in the prior month.
- Crude oil inventories dropped abruptly in the week ended July 6, after registering small gains in the prior week. U.S. stockpiles swooned by 12.6 million barrels compared to a decline of 4.1 million expected by analysts.
- U.S. inflation has risen by 0.1% month-over-month in June, slightly lower than economists had expected. Year-over-year, inflation is up 2.9%, well above the Federal Reserve’s target of 2%. Core inflation, i.e. less food and energy, rose 2.3%, perhaps giving the Fed peace of mind for now.
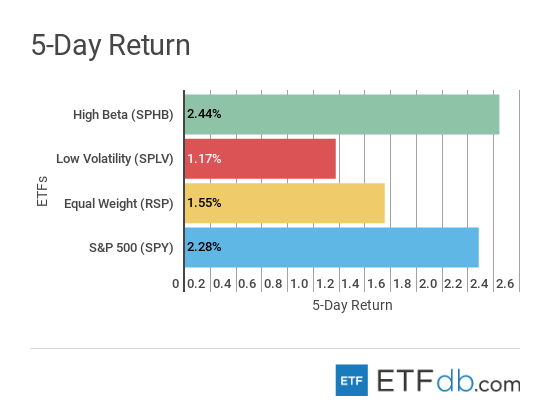
Risk Appetite Review
- The stock market continued its strong recovery this week, despite an increase in global uncertainty.
- High Beta (SPHB ) was surprisingly the best performer for the week with an advance of 2.44%.
- The broad market (SPY ) was the second-best performer, posting a rise of 2.28%.
- Low volatility (SPLV ) was the least-loved asset, up only 1.17% for the week.
Sign up for ETFdb.com Pro and get access to real-time ratings on over 1,900 U.S.-listed ETFs.
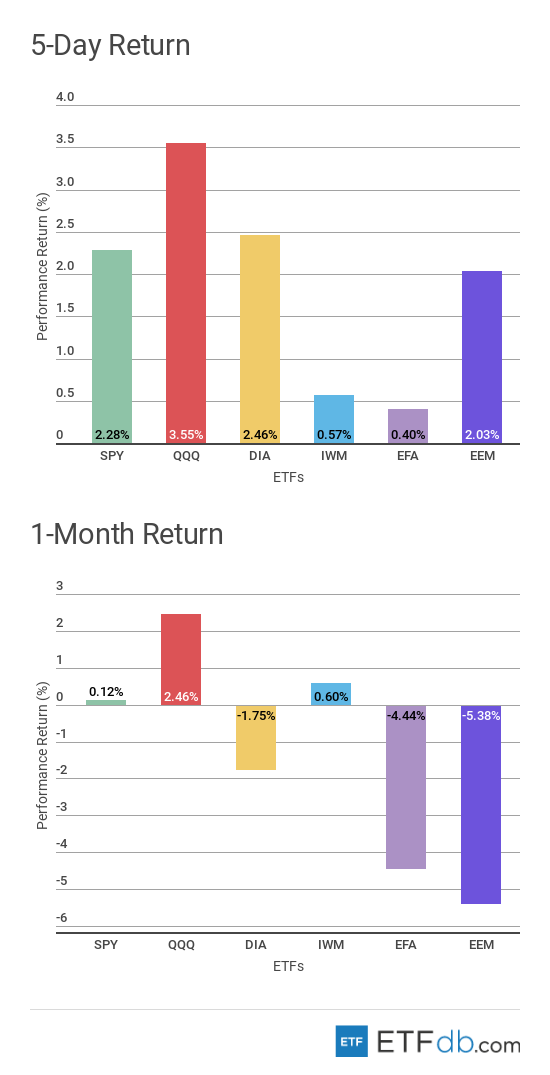
Major Index Review
- Major indexes were all up.
- The technology sector (QQQ ) has led the recovery in stocks, rising 3.55% on optimism of a strong earnings season. (QQQ ) was also the best performer for the rolling month, up an impressive 2.46%.
- The EAFE index (EFA ), which consists of European and Australasia stocks, was the worst weekly performer, staging gains of just 0.40%, hit by poor performance of Germany’s stock market.
- Emerging markets (EEM ) continue to be the worst performers for the rolling month due to a strong dollar and ongoing trade spat with China.
To see how these indices performed a week before last, check out ETF Scorecard: July 6 Edition
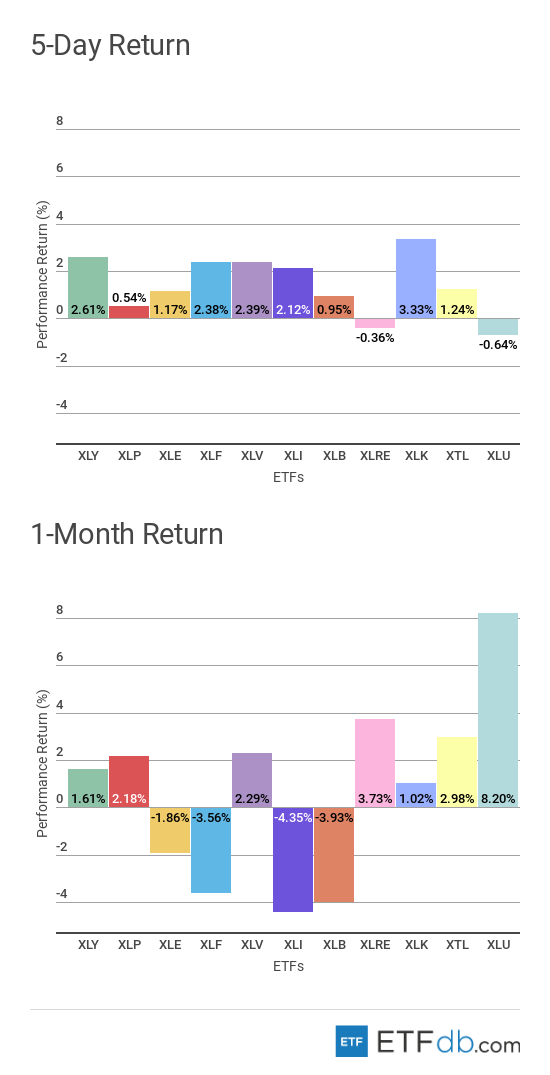
Sectors Review
- Sectors were rather mixed.
- The technology sector (XLK ) posted the largest gains for the week, up 3.33%.
- Utilities (XLU ) dropped 0.64% as investors flew away from safe-haven assets. Despite the small decline, utilities remain the best performer for the rolling month by far, up a staggering 8.2%.
- For the rolling month, the industrial sector (XLI ) is the worst performer with a fall of 4.35%, hit by trade war fears.
Use our Head-to-Head Comparison tool to compare two ETFs such as (XLU ) and (XLK ) on a variety of criteria such as performance, AUM, trading volume and expenses.
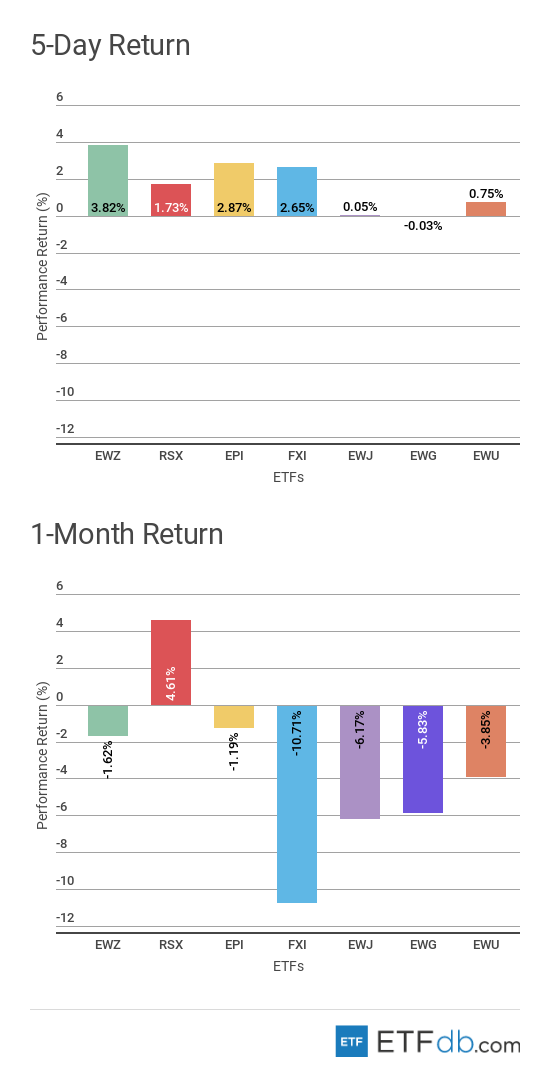
Foreign Equity Review
- Foreign equities were mixed.
- Brazilian equities (EWZ ) have rebounded this week, brushing off fears of a trade dispute between the U.S. and China. (EWZ ) has jumped 3.82% in the past five days.
- Germany (EWG ), meanwhile, is the only faller this week, as a political dispute over immigration risks toppling Angela Merkel’s government.
- For the rolling month, Russia (RSX ) is surprisingly the only gainer, helped by strong oil prices of late and an impending meeting between President Vladimir Putin and his U.S. counterpart Donald Trump. (RSX ) is up 4.61%.
- Chinese equities (FXI ) have had the roughest month of all, tumbling more than 10% in the past 30 days.
To find out more about ETFs exposed to particular countries, use our ETF Country Exposure tool. Select a particular country from a world map and get a list of all ETFs tracking your pick.
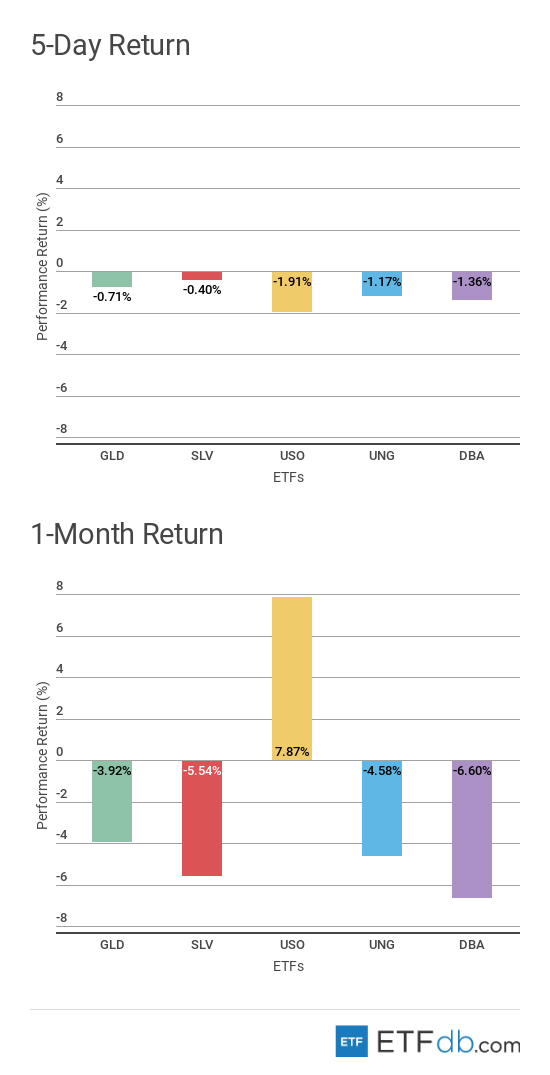
Commodities Review
- Commodities were all down.
- Oil (USO ) gave up some of its gains this week, dropping nearly 2% and becoming the worst performer for the week. The black commodity, however, remains the best performer for the rolling month and the only gainer, up 7.87%.
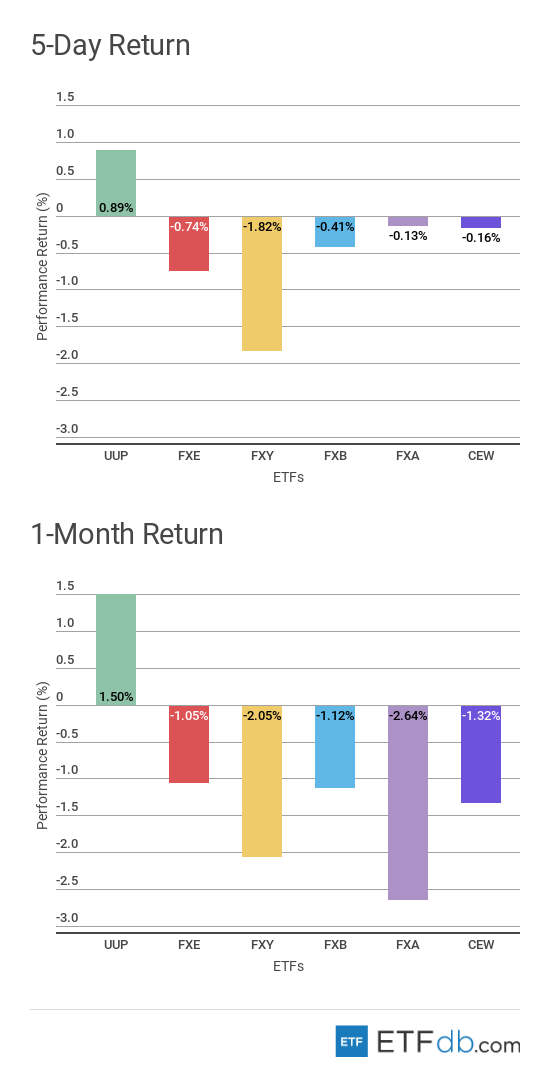
Currency Review
- Currencies were mixed.
- The U.S. dollar (UUP ) resumed its upward trajectory this week, increasing nearly 1% against a basket of developed world currencies. (UUP ) is also the only gainer for the rolling month with an advance of 1.50%.
- The Japanese yen (FXY ) has declined as much as 1.82% in the past five days, as investors shunned safe-haven assets.
- For the rolling month, the Australian dollar (FXA ) posted the biggest losses of 2.64%.
For more ETF news and analysis, subscribe to our free newsletter.