
To help investors keep up with the markets, we present our ETF Scorecard. The Scorecard takes a step back and looks at how various asset classes across the globe are performing. The weekly performance is from last Friday’s open to this week’s Thursday close.
- Summer vacation is near, making this week slow in events.
- Still, in the geopolitical realm, U.S. President Donald Trump met with his Russian counterpart Vladimir Putin, although no accord has been reached. Trump wants closer ties with Russia but he faces stiff opposition at home from the Democrats and also some Republicans.
- China’s GDP rose 6.7% in the second quarter of 2018 compared to the same period last year, which was in line with expectations. Still, the growth rate marked a modest slowdown compared to the previous quarter, likely due to an ongoing trade spat with the U.S. and the Chinese government’s fight to tame the runaway debt.
- U.S. retail sales increased 0.5% month-over-month in June, beating expectations of 0.4%. Meanwhile, the prior month’s figure was revised up to 1.3%. Core retail sales were also high, rising 0.4%, which was in line with expectations.
- U.K. unemployment rate in May stood still at 4.2%, although the number of people claiming unemployment benefits increased by 7,800.
- British CPI continued to head down amid a global disinflationary trend, despite central banks lavishing newly printed money on their economies. U.K. inflation came in at 2.4% in June year-over-year. Core CPI, which excludes volatile food, energy and alcohol, was up 1.9%, slightly below the central bank’s target.
- U.S. building permits slightly disappointed in June, coming in at 1.27 million compared with 1.34 million in the prior month.
- After an abrupt drop in recent weeks, crude oil inventories surged by 5.8 million barrels for the week ended July 13.
- U.K. retail sales dropped by 0.5% in June compared with a rise of 1.4% in the prior month. Analysts had expected a small rise of 0.1%.
Risk Appetite Review
- The stock market continued its bull run this week.
- Riskier assets were favored by investors, with High Beta (SPHB ) rising 0.63%, the best performance.
- Unsurprisingly, low volatility (SPLV ) was again an asset class that was shunned by investors, posting a tepid rise of 0.10%.
- The broad market (SPY ) has increased by 0.30% in the past five days.
Sign up for ETFdb.com Pro and get access to real-time ratings on over 1,900 U.S.-listed ETFs.

Major Index Review
- Major indexes were mixed.
- Amid fears of a global trade war and a strong dollar, emerging markets (EEM ) declined nearly 1%, while other major indexes posted advances. (EEM ) is the single faller for the rolling month, down 0.53%.
- The small-cap index (IWM ) is again on the roll, recording the best performance for the week, up 0.79%.
- For the rolling month, the technology sector (QQQ ) is the best performer with a rise of 2.74%.
To see how these indices performed a week before last, check out ETF Scorecard: July 13 Edition

Sectors Review
- Sectors posted varied performance.
- The financial sector (XLF ) was by far the best performer for the week among sectors, surging nearly 2% as some exponents, including Bank of America (BAC) reported better-than-expected results.
- The telecom sector (XTL ) fell nearly 3% for the week, representing the worst performance from the pack.
- For the rolling month, the utility sector (XLU ) was the king with a gain of 5.76%.
- Likely to suffer from the trade war between China and the U.S., the materials sector (XLB ) was the only faller for the rolling month, down 0.59%.

Use our Head-to-Head Comparison tool to compare two ETFs such as (XLF ) and (XTL ) on a variety of criteria such as performance, AUM, trading volume and expenses.
Foreign Equity Review
- Foreign equities were mixed.
- Brazilian equities (EWZ ) have continued their upward trajectory this week, rising more than 3%, despite trade war fears and a shaky political situation at home. (EWZ ) is also by far the best performer for the rolling month with a staggering gain of nearly 9%.
- Russia (RSX ), meanwhile, has dropped the most for the week, down 4.26%, due to falling oil prices. A potential thaw in relations between the U.S. and Russia did not help domestic equities.
- Chinese stocks (FXI ) are the poorest performers for the past 30 days, with a decline of 7.34% due to high debt and the trade spat with the U.S.

To find out more about ETFs exposed to particular countries, use our ETF Country Exposure tool. Select a particular country from a world map and get a list of all ETFs tracking your pick.
Commodities Review
- Commodities were again all down.
- Silver (SLV ) is the worst performer both for the week and the rolling month, down 3% and 6.2% respectively, as it was slammed by risk-embracing investors.
- The agricultural fund (DBA ) was the best weekly performer with a decline of only 0.46%.
- Although oil (USO ) gave up some of the gains this week, it remains the best monthly performer and the only gainer, up 7.86%.

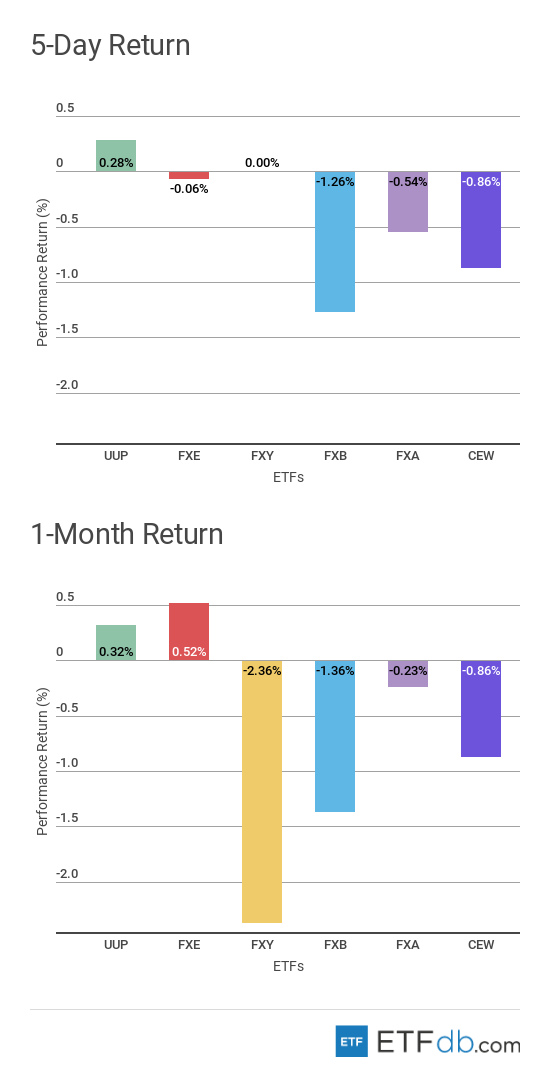
Currency Review
- Currencies were mixed.
- The U.S. dollar (UUP ) is the king for the second consecutive week, although it posted just a small advance of 0.28%.
- The British pound (FXB ) was slammed by investors as dropping inflation may convince the central bank to keep interest rates unchanged for longer.
For more ETF analysis, make sure to sign up for our free ETF newsletter.
Disclosure: No positions at time of writing.

