
News
To help investors keep up with the markets, we present our ETF Scorecard. The Scorecard takes a step back and looks at how various asset classes across the globe are performing. The weekly performance is from last Friday’s open to this week’s Thursday close.
- U.S. President Donald Trump indicated he will maintain steel and aluminum tariffs on Mexico and Canada despite reaching a trade deal. Trump also said the U.S. will likely impose tariffs on European cars if a deal cannot be sealed. The European Union may be forced to come to the negotiating table or else risk a recession amid a slight deterioration of the economic picture and the rise of populists.
- Eurozone headline inflation rose ten basis points in September to 2.1%, above the European Central Bank’s target of 2% but in line with expectations. However, core CPI unexpectedly dropped to 0.9% from 1% in the prior month. Inflation was largely driven by higher energy prices. Across Europe, the inflation picture was rather divergent, with Italy’s CPI dropping 0.4% compared to the same period last year.
- In steady decline for the nine months through September, U.K. manufacturing purchasing managers’ index is finally giving investors reasons to cheer. Manufacturing PMI rose to 53.8 in October from 53, beating expectations of 52.6.
- U.S. sentiment in manufacturing slightly fell in October, although it is still hovering near record highs. Institute for Supply Management’s PMI came in at 59.8, down from 61.3 in the prior month.
- Meanwhile, ISM’s non-manufacturing PMI rose to a 12-year high of 61.6 in October, up from 58.5 previously. Last time PMI was so strong was in 2006, shortly before the financial crisis.
- Crude oil inventories rose a staggering 8 million barrels for the week ended September 28, marking the first two consecutive weekly rises since May.
- The U.S. jobs market could not be in better shape, ADP’s latest figures indicate. The U.S. economy added as many as 230,000 jobs in September, beating expectations of 185,000.
Risk Appetite Review
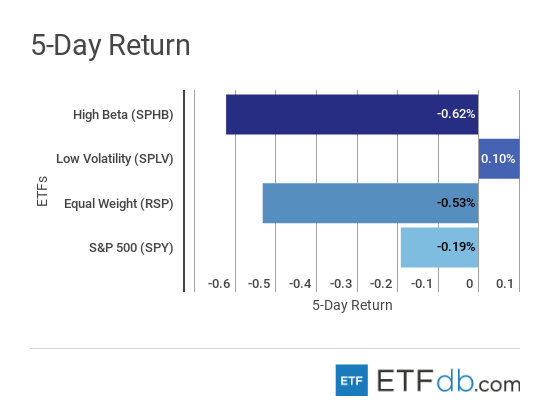
- Markets were mostly down this week.
- Risk assets (SPHB ) dropped 0.62%, the worst performer from the pack.
- Meanwhile, low volatility (SPLV ) was the only gainer for the week with a tepid rise of 0.10%.
- The broad market (SPY ) declined slightly.
- Sign up for ETFdb.com Pro and get access to real-time ratings on over 1,900 U.S.-listed ETFs.
Content continues below advertisement
Major Index Review
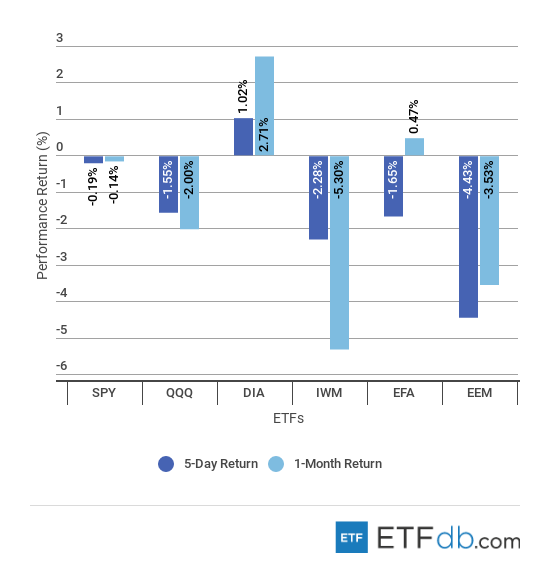
- Major indexes were mixed.
- Blue chip-heavy Dow Jones (DIA ) is the best performer for the week, posting gains of more than 1%. For the rolling month, (DIA ) is up 2.71%, representing the best performance.
- Emerging markets (EEM ) declined as much as 4.43%, as investors are fearful of rising interest rates in the U.S., a strong dollar and an ongoing trade war between the U.S. and China. Political and economic upheavals in South America and Turkey, and a potential systemically-important bankruptcy in India are not helping either.
- Small-cap stocks (IWM ) were killed over the past 30 days, tumbling 5.3%. On the bright side, such sell-offs are typically followed by strong gains.
- To see how these indices performed a week before last, check out ETF Scorecard: September 28 Edition
Sectors Review
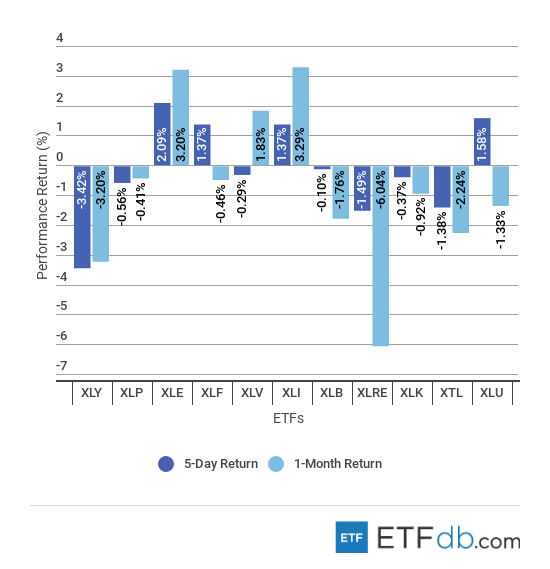
- Consumer discretionary (XLY ) nosedived 3.42% in the past five days, reversing some gains recorded in previous weeks.
- Amid a bleak picture across sectors, energy stocks (XLE ) advanced as much as 2.09% for the week and were the second-best performers from the pack.
- For the rolling month, industrials (XLI ) were the best performers, surging 3.29%, while real estate stocks (XLRE ) were at the other end of the spectrum, losing more than 6%.
- Use our Head-to-Head Comparison tool to compare two ETFs such as (XLI ) and (XLE ) on a variety of criteria such as performance, AUM, trading volume and expenses.
Foreign Equity Review
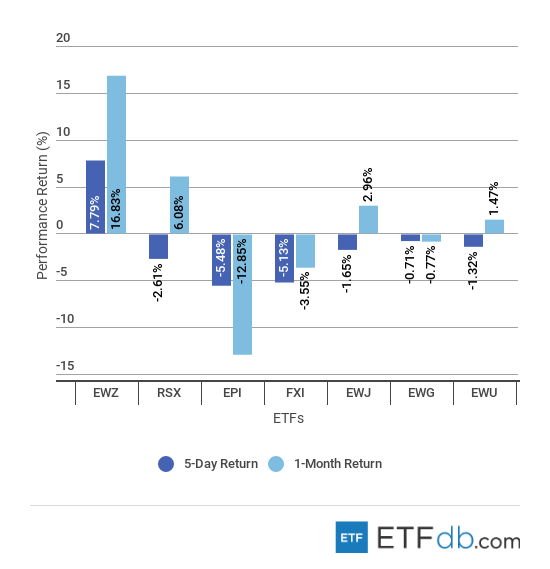
- Brazil (EWZ ) is the best performer for the week and the rolling month by far, as the country is preparing for a crucial presidential election. (EWZ ) is up nearly 8% for the week, extending monthly gains to an impressive 16.83%. Right wing candidate Jair Bolsonaro is leading in polls, with markets approving of him because he appointed a respected financier to lead his economic policy.
- India (EPI ) continued to stumble this week, falling 5.48%, as expectations are increasing that the central bank will raise interest rates. (EPI ) is also the worst performer for the rolling month, down 12.85%.
- To find out more about ETFs exposed to particular countries, check out our ETF Country Exposure tool. Select a particular country from a world map and get a list of all ETFs tracking your pick.
Commodities Review
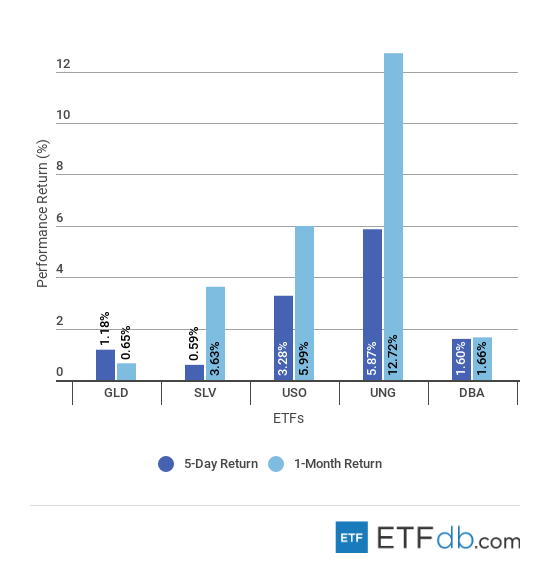
- Commodities were surprisingly all up.
- Natural gas (UNG ) is the best weekly performer for two weeks in a row, up 5.87% in the past five days. Unsurprisingly, natural gas is also the best performer for the rolling month, up 12.72%.
- Silver (SLV ) showed the smallest gains during the week, up 0.59%.
- Gold (GLD ) was the worst performer for the rolling month with a rise of merely 0.65%.
Currency Review
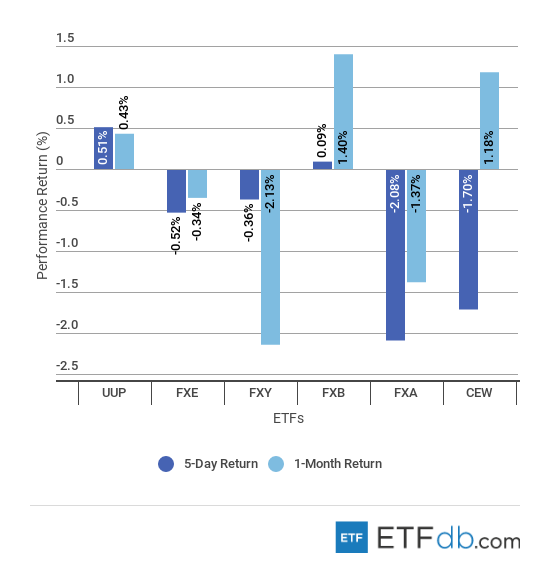
- The U.S. dollar (UUP ) was the king for the past five days, rising 0.51%, as investor expectations are increasing that the central bank will tighten monetary policy at a faster pace.
- The Australian dollar (FXA ) is down as much as 2.08% for the week.
- For the rolling month, the British pound (FXB ) is the best performer, up 1.40%, on hopes a Brexit deal can be achieved.
- The Japanese yen (FXY ) had the worst fate for the past 30 days, falling 2.13%.
- For more ETF news and analysis, subscribe to our free newsletter.
Disclosure: No positions at time of writing.

