ETFdb Logo
  • ETF Database
  • Content Hubs
    • Themes
      • Active ETF
      • Alternatives
      • Artificial Intelligence
      • China Insights
      • Core Strategies
      • Crypto
      • Disruptive Technology
      • Energy Infrastructure
      • ETF Building Blocks
      • ETF Investing
      • ETF Strategist
      • Financial Literacy
      • Fixed Income
      • Free Cash Flow
      • Future ETFs
      • Innovative ETFs
      • Institutional Income Strategies
      • Leveraged & Inverse
      • Market Insights
      • Market Outlooks
      • Modern Alpha
      • Nuclear Energy
      • Portfolio Strategies
      • Sector Investing
      • Tax Efficient Income
      • Thematic Investing
    • Asset Class
      • Equity
        • U.S. Equity
        • Int'l Developed
        • Emerging Market Equities
      • Alternatives
        • Gold/Silver/Critical Materials
        • Cryptocurrency
        • Currency
        • Volatility
      • Fixed Income
        • Investment Grade Corporates
        • US Treasuries & TIPS
        • High Yield Corporates
        • Int'l Fixed Income
    • ETF Ecosystem
    • ETFs in Canada
    • Market Outlook
    • Crypto ETF Hub
  • Tools
    • ETF Screener
    • ETF Country Exposure Tool
    • ETF Database Categories
    • Indexes
    • Scenario Analysis
    • Watchlists
    • Head-To-Head ETF Comparison Tool
    • Mutual Fund To ETF Converter
    • ETF Stock Exposure Tool
    • ETF Issuer Fund Flows
  • Research
    • ETF Education
    • Equity Investing
    • Dividend ETFs
    • Leveraged ETFs
    • Inverse ETFs
    • Index Education
    • Index Insights
    • Top ETF Sectors
    • Top ETF Issuers
    • Top ETF Industries
  • Webcasts
  • Sectors
    • Sector Investing Content Hub
    • XLK
    • XLI
    • XLU
    • XLY
    • XLP
    • XLRE
    • Sector Power Rankings
    • XLE
    • XLC
    • XLF
    • XLV
    • XLB
  • Multimedia
    • ETF 360 Video Series
    • ETF of the Week Podcast
    • Gaining Perspective Podcast
    • ETF Prime Podcast
    • Video
  • Company
    • About VettaFi
  • PRO
    • Pro Content
    • Pro Tools
    • Advanced
    • FAQ
    • Free sign up
    • Login
  1. Chart of the Week: What Factors Matter Most
News
Share

Chart of the Week: What Factors Matter Most

Todd RosenbluthAug 18, 2022
2022-08-18

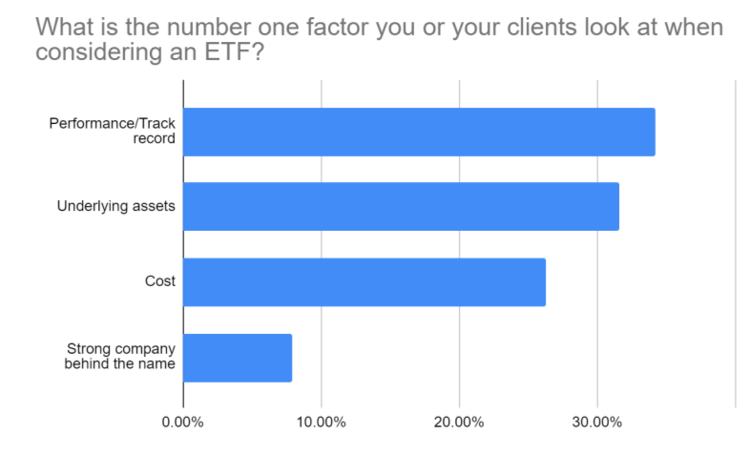
With the ETF market becoming more crowded weekly, advisors have their hands full trying to sort through the universe. For years, we have found the ETF due diligence process to be similar to that of a mutual fund, with a review of a fund’s performance track record topping the list. Indeed, during an ETF webcast for advisors in mid-August with U.S. Global Investors, we asked, “What is the number one factor you or your clients look at when considering an ETF?” Performance/track record was selected by 34% of respondents, more than any other choice provided. However, underlying assets (32%) and cost (26%) were also very popular, and were significantly ahead of the strong company behind the name (7.9%).

Factor 0822 Image Graph Chart

While we believe that advisors are increasingly looking at more than one factor when considering an ETF, performance success is a hard one to solely rely upon for a variety of reasons. Most ETF assets are tied to an underlying index, which means that the asset manager deserves little credit for choosing the stocks or bonds that went up more or down less than what is held in a competing ETF. If we were to award points for this, they would likely go to the index provider that came up with the rules and left them unchanged despite shifting investor sentiment. 

In addition, as has been repeated many times, past performance is not necessarily indicative of future results. Most ETFs rose in value in 2021 and declined in the first half of 2022, only to bounce back in recent weeks. So, picking your time period matters.

Cost is also a reliable factor used to choose an ETF and one that asset managers have control over. However, with the asset-weighted expense ratio down to 0.18% as of the end of June 2022, there’s little distinction between the fees that popular funds charge. Yet, there is often a performance disparity that occurs due to the underlying assets of the ETFs.

For example, there are many focused on U.S. mid-cap investments that charge an expense ratio of 0.05% or less including one, the SoFi Next 500 ETF (SFYX ), which has no fee but also has only approximately $50 million in assets. 

The two largest of these “cheap” mid-cap ETFs are the iShares Core S&P Mid-Cap ETF (IJH A-) and the Vanguard Mid-Cap ETF (VO B), which are offered by the two largest ETF providers. At 0.04%, the $53 billion VO has a fee that is one basis point lower than that of the $65 billion IJH — hardly a reason to choose one ETF over another — and yet, IJH’s year-to-date loss of 7.1% as of August 15 was more than 300 basis points narrower than VO’s 10.3%.

Despite a similar name, there are differences in the ETFs’ underlying assets. VO’s five largest holdings are Synopsys (SNPS), Centene (CNC), Cadence Design Systems (CDNS), Amphenol Corp (APH), and IQVIA Holdings (IQV). However, none can be found in the S&P 400 Midcap Index-based IJH, as these companies are part of the large-cap S&P 500 Index and part of the iShares Core S&P 500 ETF (IVV A). IJH’s top five positions are Carlisle Companies (CSL), Targa Resources (TRGP), Steel Dynamics (STLD), EQT (EQT), and Repligen (RGEN).

The BNY US Mid Cap Core Equity ETF (BKMC ), the iShares Morningstar Mid-Cap ETF (IMCB ), the Schwab US Mid-Cap ETF (SCHM A+), and the SPDR Portfolio S&P 400 Mid Cap ETF (SPMD A+) are other low-cost alternatives for advisors to consider when seeking exposure to mid-sized companies. 

While SPMD tracks the same index as IJH, the three other ETFs own a unique portfolio of assets and thus a distinct track record. So it is encouraging to see that advisors are prioritizing what’s inside an ETF more than its costs, but their unique track records make a simple performance-based review problematic. The tools on VettaFi’s ETF Database can help compare these ETFs across various metrics.

To see more of Todd’s research, reports, and commentary on a regular basis, please subscribe here.

For more news, information, and strategy, visit VettaFi.


Content continues below advertisement

» Popular Pages

  • Tickers
  • Articles

Jun 18

S&P 500 Snapshot: Peace Deal Overcomes Fed Jitters

Jun 18

Treasury Yields Snapshot: June 18, 2026

Jun 18

Volatility Protection & Income in a Dynamic Buffered ETF

Jun 18

Covered Call ETFs Have Boomed – But Can They Be More?

Jun 18

Dimensional Consolidates $250B Lineup Into ETF Share Classes

Jun 18

NUKZ Holding Constellation Injects Millions Into Local Economies

Jun 18

What Drives Active ETF Growth? NEOS and Thornburg Weigh In

Jun 18

Capital Rotation: A Breakdown of This Week's Top ETF Flows

Jun 18

iShares Launches New Bitcoin Income ETF 

Jun 18

Kurv Launches SpaceX Enhanced Income ETF

QQQ

Invesco QQQ Trust Series I

VOO

Vanguard S&P 500 ETF

DRAM

Roundhill Memory ETF

GLD

SPDR Gold Shares

SOXX

iShares Semiconductor ETF

PPLT

abrdn Physical Platinum...

FETH

Fidelity Ethereum Fund ETF

FBTC

Fidelity Wise Origin Bitcoin...

SCHD

Schwab US Dividend Equity ETF...

SIVR

abrdn Physical Silver Shares...


Content continues below advertisement

Loading Articles...

Advertisement

Is Your Portfolio Positioned With Enough Global Exposure?

ETF Education Channel

How to Allocate Commodities in Portfolios

Tom LydonApr 26, 2022
2022-04-26

A long-running debate in asset allocation circles is how much of a portfolio an investor should...

Core Strategies Channel

Why ETFs Experience Limit Up/Down Protections

Karrie GordonMay 13, 2022
2022-05-13

In a digital age where information moves in milliseconds and millions of participants can transact...

}
X