ETFdb Logo
  • ETF Database
  • Content Hubs
    • Themes
      • Active ETF
      • Alternatives
      • Artificial Intelligence
      • China Insights
      • Core Strategies
      • Crypto
      • Disruptive Technology
      • Energy Infrastructure
      • ETF Building Blocks
      • ETF Investing
      • ETF Strategist
      • Financial Literacy
      • Fixed Income
      • Free Cash Flow
      • Future ETFs
      • Innovative ETFs
      • Institutional Income Strategies
      • Leveraged & Inverse
      • Market Insights
      • Market Outlooks
      • Modern Alpha
      • Nuclear Energy
      • Portfolio Strategies
      • Sector Investing
      • Tax Efficient Income
      • Thematic Investing
    • Asset Class
      • Equity
        • U.S. Equity
        • Int'l Developed
        • Emerging Market Equities
      • Alternatives
        • Gold/Silver/Critical Materials
        • Cryptocurrency
        • Currency
        • Volatility
      • Fixed Income
        • Investment Grade Corporates
        • US Treasuries & TIPS
        • High Yield Corporates
        • Int'l Fixed Income
    • ETF Ecosystem
    • ETFs in Canada
    • Market Outlook
    • Crypto ETF Hub
  • Tools
    • ETF Screener
    • ETF Country Exposure Tool
    • ETF Database Categories
    • Indexes
    • Scenario Analysis
    • Watchlists
    • Head-To-Head ETF Comparison Tool
    • Mutual Fund To ETF Converter
    • ETF Stock Exposure Tool
    • ETF Issuer Fund Flows
  • Research
    • ETF Education
    • Equity Investing
    • Dividend ETFs
    • Leveraged ETFs
    • Inverse ETFs
    • Index Education
    • Index Insights
    • Top ETF Sectors
    • Top ETF Issuers
    • Top ETF Industries
  • Webcasts
  • Sectors
    • Sector Investing Content Hub
    • XLK
    • XLI
    • XLU
    • XLY
    • XLP
    • XLRE
    • Sector Power Rankings
    • XLE
    • XLC
    • XLF
    • XLV
    • XLB
  • Multimedia
    • ETF 360 Video Series
    • ETF of the Week Podcast
    • Gaining Perspective Podcast
    • ETF Prime Podcast
    • Video
  • Company
    • About VettaFi
  • PRO
    • Pro Content
    • Pro Tools
    • Advanced
    • FAQ
    • Free sign up
    • Login
  1. Index Insights
  2. The More Things Change, the More They Stay the Same: Examining the MLP Yield to Treasuries Spread
Index Insights
Share

The More Things Change, the More They Stay the Same: Examining the MLP Yield to Treasuries Spread

Karyl PatredisJul 11, 2017
2017-07-11

Do you have an updated yield spread chart?

Almost two years ago, I wrote a post about the Alerian MLP Index (AMZ) yield compared to the yield of the 10-year Treasury. On July 24th, 2015, the 10-year Treasury closed at 2.27%, while the AMZ closed at 6.96%. The spread was 470 bps and there was lots of speculation about why the yield spread was well above the 10-year median of 337 bps. At the time, we wondered if it could be that investors were pricing MLPs with the expectation that the 10-year Treasury rate would increase significantly over the next year.

Jump forward to present day. On June 20, 2017, the 10-year Treasury closed at 2.30%, while the AMZ closed at 7.13%. This means the yield spread is a little higher today than a couple of years ago, but really, things aren’t that much different today than they were the last time I examined yield spread.

This is the image alt text

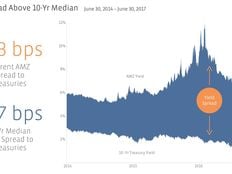
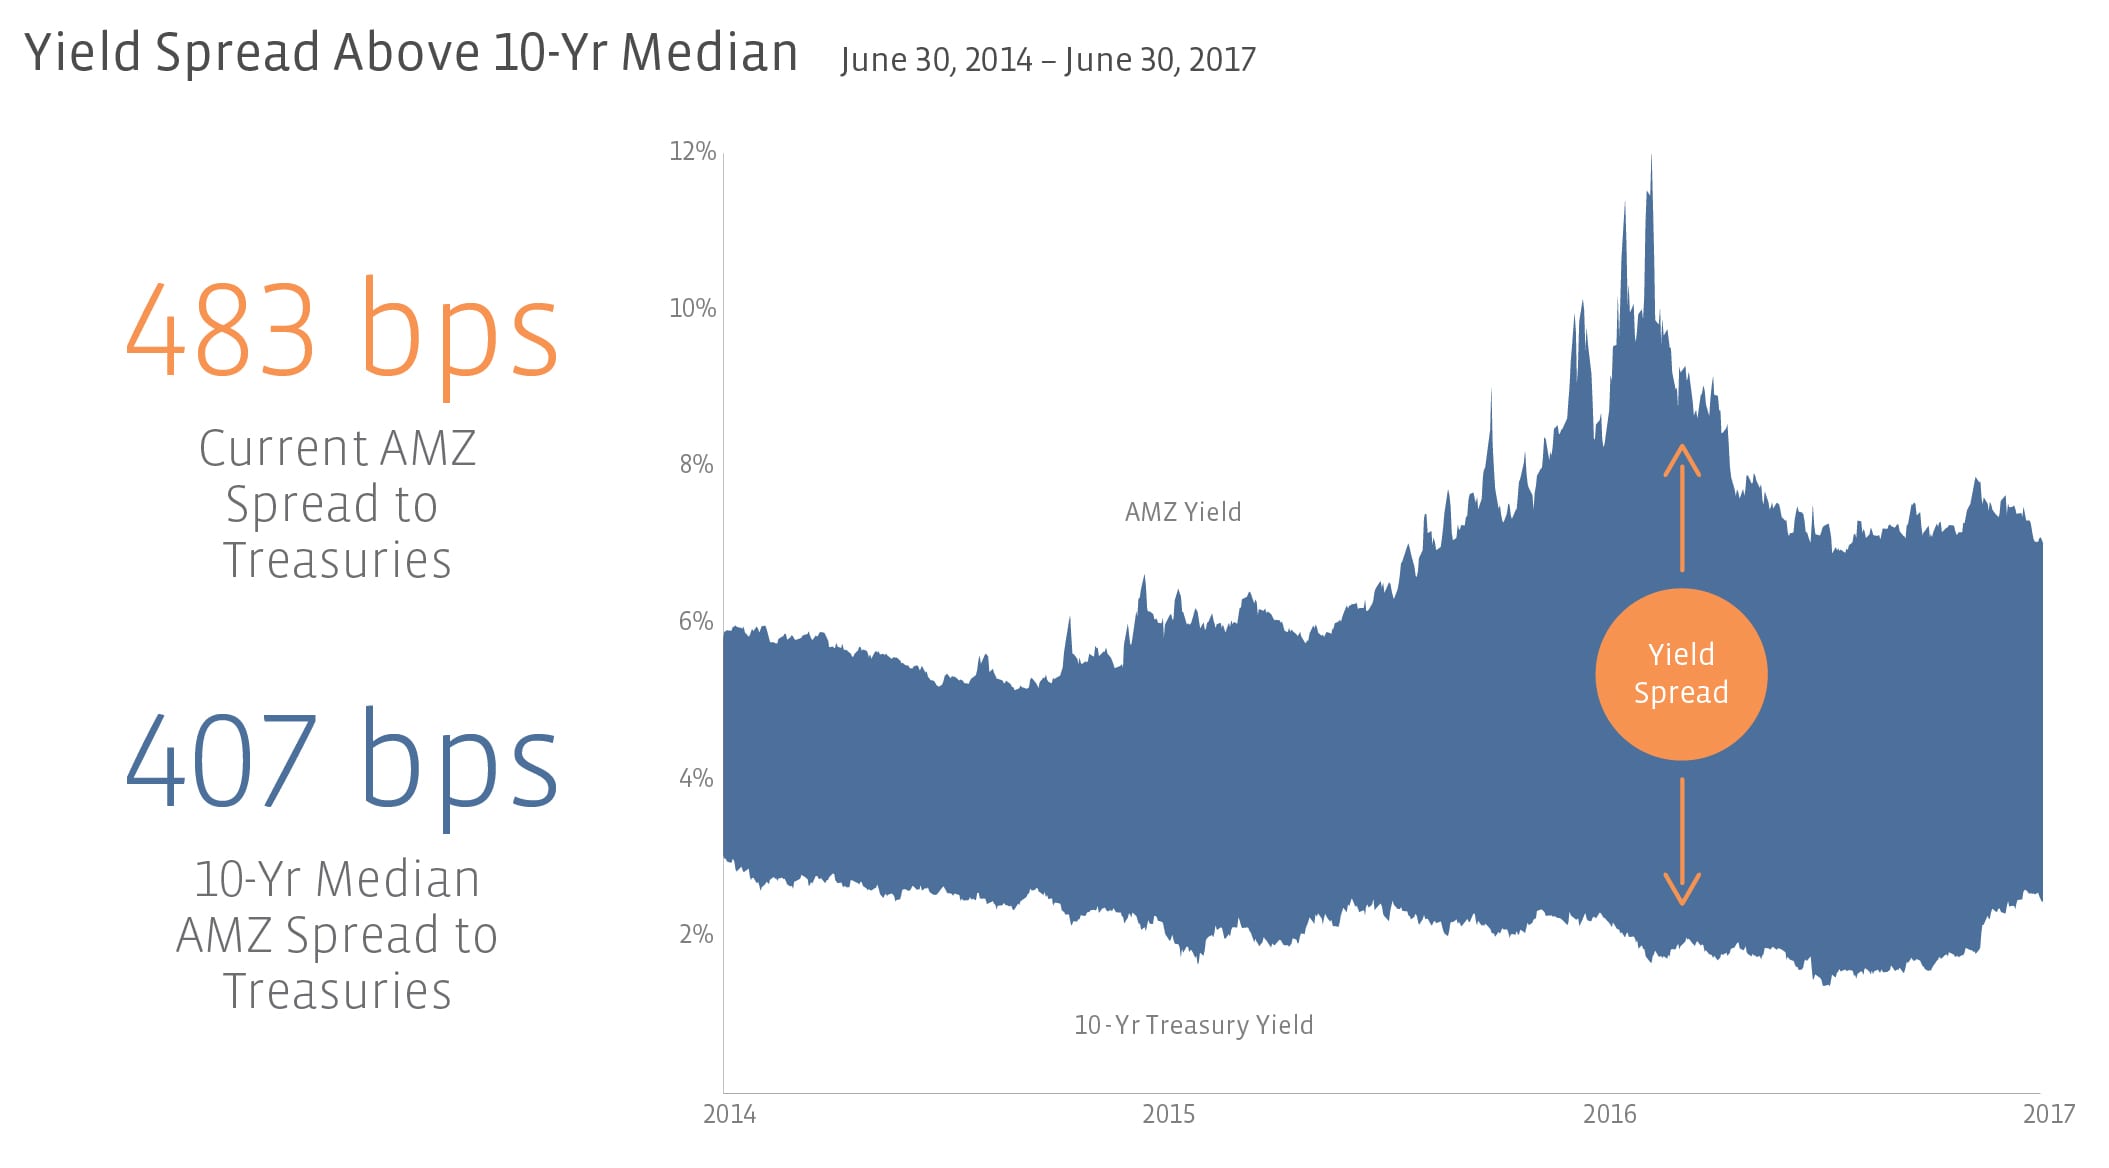
Although the snapshots between now and then look relatively similar, a lot happened over the last two years. If you’re wondering about that spike in the chart in early 2016, that reflects the day MLPs hit their low of the recent energy cycle. The AMZ was yielding 12.01% on that day and the 10-year Treasury was at 1.66%! That’s a spread of 1035 bps for those of you playing along at home. The rolling 10-Yr median AMZ spread to treasuries has increased by 70 bps and the lowest spread we’ve seen over the past two years was 413 bps in January 2017.

So, what does all of this mean?

Well, it could mean a few things. One is that investors are still expecting interest rates to rise. This isn’t an empty expectation. Economists do believe we’ll see a bump in the 10-year Treasury by the end of 2017, but it won’t be too earth-shattering. They say we can expect an increase of about 10 bps.

It could also mean that MLPs are undervalued. Some say that even with oil hovering around $50 per barrel, there is an increasing need for midstream services. Due to new technologies and improved efficiencies, wells are being drilled two times faster and seeing three times as much production. Is it possible that investors aren’t fully grasping the extent of midstream services that will be needed to get oil to market?

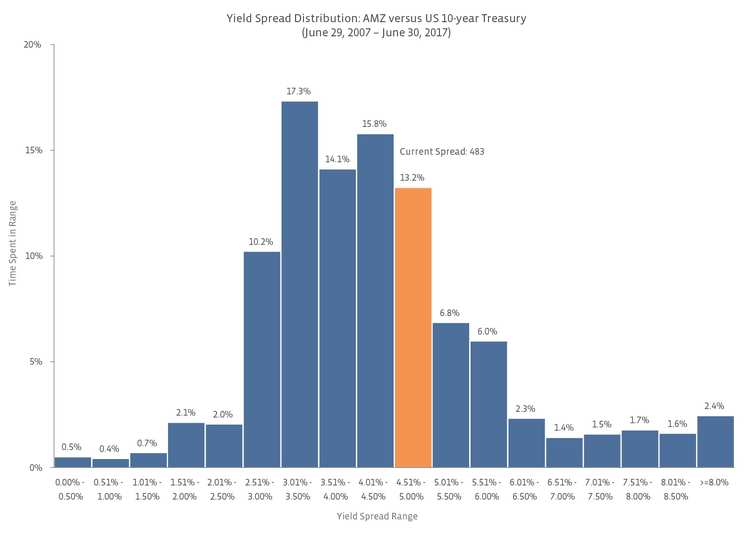
Or possibly, this is the new normal. The chart below shows ten years of yield spread history. Each bar represents a spread grouping and the y-axis reflects percentages of time. While spreads within the 3.01%-3.50% were still seen most frequently, it is becoming increasingly more likely to see spreads in the 4.51%-5.00% range. In 2015, spreads in this group only occurred about 10% of the time, now we’re looking at 13.2% of the time.


Content continues below advertisement

This is the image alt text

Is it conceivable that this is just the spread MLP investors can expect in the near future? Most can agree there are much worse things than 7% yields!

As we move forward in an ever-changing financial climate and oil price environment, we will look at the effects of interest rate increases with fresh eyes. Alerian’s Director of Research will release an update to our existing white paper discussing MLPs and interest rates in the next few weeks. Stay tuned!

» Popular Pages

  • Tickers
  • Articles

Jun 23

National Bank Launches New NBI Thematic Rotation ETF

Jun 23

REIT ETFs: Real Estate's Quiet Revival

Jun 23

Benchmarks Are Broken: Why Antiquated Methodologies Fail Fixed Income

Jun 23

How SFLO Finds Quality Companies in Volatile Small-Cap Value Investing

Jun 23

Add Diversification As SMID-Cap ETF TMSL Celebrates Milestone 

Jun 23

Hyperliquid Takes on Traditional Derivatives Markets

Jun 23

India ETFs Worth Examining Following Market’s Rough 2026 Start

Jun 23

Search for Income Should Include International Markets

Jun 23

U.S. Oil Production Outlook & Midstream Implications

Jun 23

Why the Bond King Is Betting on Hikes, Hype & Global Rotation

QQQ

Invesco QQQ Trust Series I

VOO

Vanguard S&P 500 ETF

GLD

SPDR Gold Shares

SMH

VanEck Semiconductor ETF

DRAM

Roundhill Memory ETF

SOXX

iShares Semiconductor ETF

PPLT

abrdn Physical Platinum...

SIVR

abrdn Physical Silver Shares...

SCHD

Schwab US Dividend Equity ETF...

SOXL

Direxion Daily Semiconductor...

Loading Articles...

Advertisement

Is Your Portfolio Positioned With Enough Global Exposure?

ETF Education Channel

How to Allocate Commodities in Portfolios

Tom LydonApr 26, 2022
2022-04-26

A long-running debate in asset allocation circles is how much of a portfolio an investor should...

Core Strategies Channel

Why ETFs Experience Limit Up/Down Protections

Karrie GordonMay 13, 2022
2022-05-13

In a digital age where information moves in milliseconds and millions of participants can transact...

}
X