
The real estate industry received a boost in August 2016 when the S&P Dow Jones and MSCI moved real estate investment trusts (REITs) into their own GICS® classification.
Since the GICS® classifications are widely used for indexing, the new classification as a ‘sector’ opened the door to wider exposure to investors through exchange-traded funds (ETFs). But investors may want to look beyond market capitalization-weighted funds when evaluating their options.
In this article, we’ll look at how smart beta works for real estate ETFs, and whether investors should consider them for their portfolios.
Smarter Real Estate Investing
Traditional real estate ETFs are weighted by market capitalization, which gives investors the most exposure to the largest REITs. The problem with this approach is that it may lead to uneven exposure to the real estate industry. For example, office properties may represent the most market capitalization while lodging or self-storage might be left behind. This may leave investors over-exposed to office properties and less diversified in other areas.
Smart beta REIT ETFs enable investors to employ alternative strategies to gain exposure to the real estate industry. For example, the Lattice Real Estate Strategy ETF (RORE ) weights REITs by valuation, momentum and quality rather than market capitalization. This means that investors could see greater exposure to areas of the market that are undervalued and/or strong performers rather than those that simply happen to be the largest.
Some of the most popular smart beta real estate ETFs include:
| Name | Ticker | Expense Ratio | Strategy |
|---|---|---|---|
| Lattice Real Estate Strategy ETF | (RORE ) | 0.45% | Weights REITs based on valuation, momentum, and quality. |
| Guggenheim S&P 500 Equal Weight Real Estate ETF | (EWRE ) | 0.40% | Weights REITs equally to even out exposure. |
| SuperDividend REIT ETF | (SRET ) | 0.58% | Equally weights REITs based on their yield and volatility. |
| PowerShares KBW Premium Yield Equity REIT Portfolio ETF | (KBWY ) | 0.35% | Weights small- to mid-cap REITs based on their yield. |
How Does Smart Beta Compare?
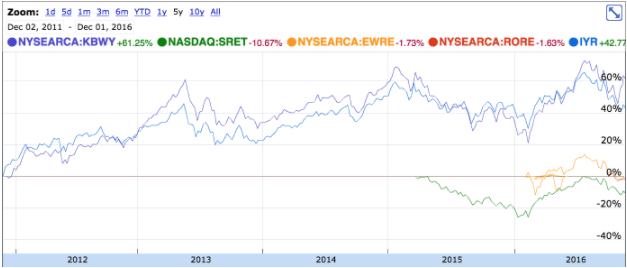
The benchmark traditional REIT ETF is the iShares U.S. Real Estate ETF (IYR ), which has approximately $3.7 billion in assets under management, as of December 2016. In the chart and table below, we compare this benchmark ETF with smart beta REIT ETFs to see how their performance compares over multiple time periods, although it’s worth noting that smart beta REIT ETFs are relatively new and historical data is limited.
| Ticker | 1-Year | 3-Year | 5-Year |
|---|---|---|---|
| (IYR ) | 5.53% | 34.95% | 65.88% |
| (RORE ) | N/A | N/A | N/A |
| (EWRE ) | 3.36% | N/A | N/A |
| (SRET ) | 20.90% | N/A | N/A |
| (KBWY ) | 28.69% | 47.93% | 117.47% |
In addition to total returns, investors may want to consider differences in risk profiles when deciding between smart beta and traditional REIT ETFs. Some ETFs may also offer higher yields than others, which is important for income investors to consider. For example, the PowerShares KBW Premium Yield Equity REIT Portfolio ETF (KBWY ) smart beta fund consistently outperformed the popular iShares U.S. Real Estate ETF (IYR ) across 1-, 3- and 5-year timeframes.
The Bottom Line
Real estate is a relatively new asset class under the GICS® classification system, which means that most ETFs in the space have a limited operating history. Investors can use ETFdb’s ETF Screener to identify smart beta alternatives to REIT ETFs to mitigate risks or enhance returns. Of course, investors should also consider several other factors when purchasing these ETFs, including their expense ratios and liquidity.
Further Reading
For more information, see the following resources.
- How Smart Beta Affects Other Asset Classes – Part 1
- How Smart Beta Works for Fixed Income ETFs – Part 2
- How Smart Beta Works for Commodity ETFs – Part 3
For a complete list of smart beta ETFs, see ETFdb’s Smart Beta ETF list.

